Soil testing is the basis for an effective soil fertility management program. The following standard principles apply whether using conventional or conservation tillage:
- Prior to sampling, check with the laboratory for information concerning sampling depth, packaging, information forms, typical laboratory turnaround time, analyses performed and fees. Contact information for state laboratories in the Southeast can be found online through the Southern Extension and Research Activities Information Exchange Group. (Search for “sera6” to find the website.) Private laboratories provide similar analyses but may utilize different extractants and procedures. Be aware that there are regional differences in procedures and calibration databases. Verify that the lab’s testing methods have appropriate local interpretations.
- Use tools such as a stainless steel or chrome-plated sampling probe and a clean plastic bucket to avoid contamination.
- Samples must be representative of the field or portion of the field of interest. This requires planning to ensure that an adequate spacing and number of cores are collected from a consistent depth.
- Routine samples are easiest to interpret when collected at the same time of year or same point in the crop rotation.
- To diagnosis problem areas, more detailed sampling is useful. Collect separate samples from both problem and normal areas of fields, and from surface and subsurface layers.
See the North Carolina State University Extension publication Soil Facts: Careful Soil Sampling—The Key to Reliable Soil Test Information (AG-439-30) [29] or a similar publication from another state for more details. Search for “careful soil sampling” to find publications and websites that provide information on soil sampling.
Vertical Stratification
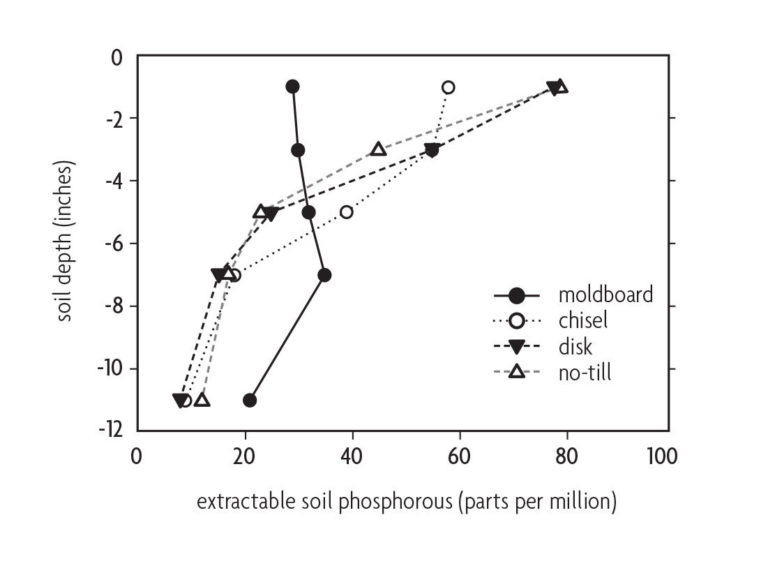
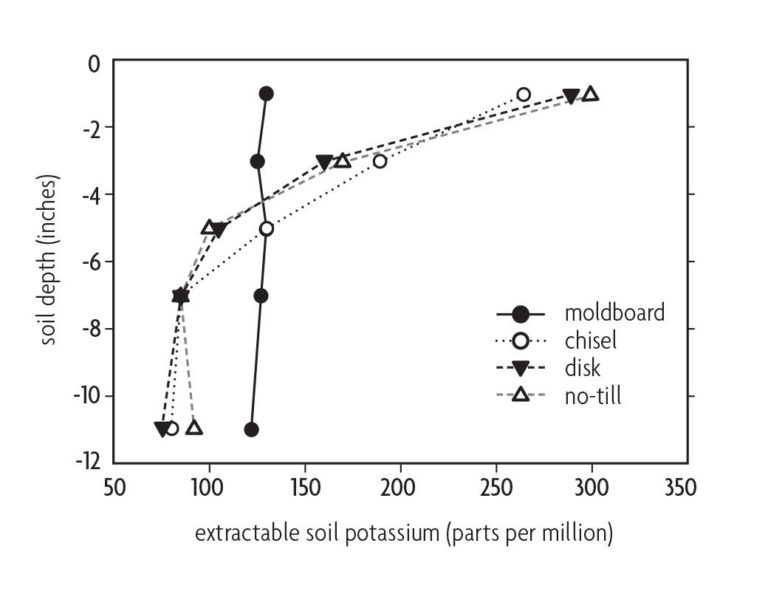
Surface application of lime and fertilizer to no-till fields often leads to nutrient stratification. Take this into account when sampling. Stratification means the upper few inches of soil contain most of the applied plant nutrients, whereas the subsoil contains fewer nutrients. This is especially true for phosphorus, which is relatively immobile in soils (Figure 10.7) [31, 16]. In practice, the biggest difference in stratification occurs between moldboard plowing and other less intensive tillage practices or no-till. Neither disk nor chisel plowing thoroughly mix nutrients into the profile (Figure 10.7). The effect of strip tillage will depend on the width and depth of tillage and whether lime and fertilizers are broadcast or banded in the tillage zone.
In conservation tillage fields, take soil samples at a shallower depth than in conventionally tilled fields [20]. Crop responsiveness to phosphorus or potassium fertilizer is better correlated with soil nutrient levels in the enriched surface soil than with the underlying soil [41]. Crop rooting is usually more prolific in the surface soil layer [26], and acidity due to the nitrification of surface-applied nitrogen fertilizers can be localized in this layer [21]. Although more crop roots may be present in the nutrient-enriched surface soil, nutrient stratification is not a problem if there are enough deep roots to acquire needed moisture from the subsoil.
Two contrasting factors influence the nature of soil pH stratification. First, nitrification reactions generate acidity and reduce surface soil pH following nitrogen fertilization. Second, lime neutralizes acidity and increases surface soil pH. Soil pH stratification patterns vary depending on soil type and lime management (Table 10.2). If prior tillage management has incorporated lime to a depth of only 3 or 4 inches, low soil pH may limit root development in acidic subsoils. Several years may be required for surface-applied lime to neutralize subsoil acidity [6, 7]. In conservation tillage fields with low pH subsoils, incorporate lime and then return to conservation tillage practices or apply lime more frequently.
Occasional sampling to check for stratification in the soil profile is recommended. A simple way to collect samples from two soil depths is to use a soil probe and two buckets. If samples are desired from 0–4 inches and 4–8 inches, probe to 8 inches, divide the soil core in half, and place the halves in separate buckets. Most laboratories recommend sampling to a typical plow layer depth, usually 8 inches, but this varies with soil texture and actual plowing depth. With conservation tillage, especially with continuous no-till, the recommended sampling depth is shallower, 0–4 inches. But, awareness of the type and degree of stratification can help producers decide if their optimum routine sampling depth is 2, 4, 6 or 8 inches. If soil pH is more acidic near the surface, a shallow soil sample will detect it. Deeper sampling is required to determine the pH below 4 inches.
Banding Fertilizer
Fertilizers are sometimes placed in bands near the crop roots to reduce the total amount applied. Subsurface band placement also reduces surface runoff losses and nutrient stratification [43]. Spring-planted crops respond better to starter fertilizers with conservation tillage than with conventional tillage due to cooler soil temperatures. Cooler soil temperatures slow root development and thus limit the volume of soil explored by the roots of developing seedlings. An ideal placement for starter fertilizer bands is 2 inches to the side and 2 inches below the seed. Other fertilizer placements may also be adequate, such as surface banded or in the crop seed furrow. Sidedressed liquid nitrogen fertilizers can be banded by either subsurface placement behind a coulter/knife or by surface placement with an orifice, parallel-oriented flat-fan nozzle, or rubber-hose attachment to narrow the fertilizer stream.
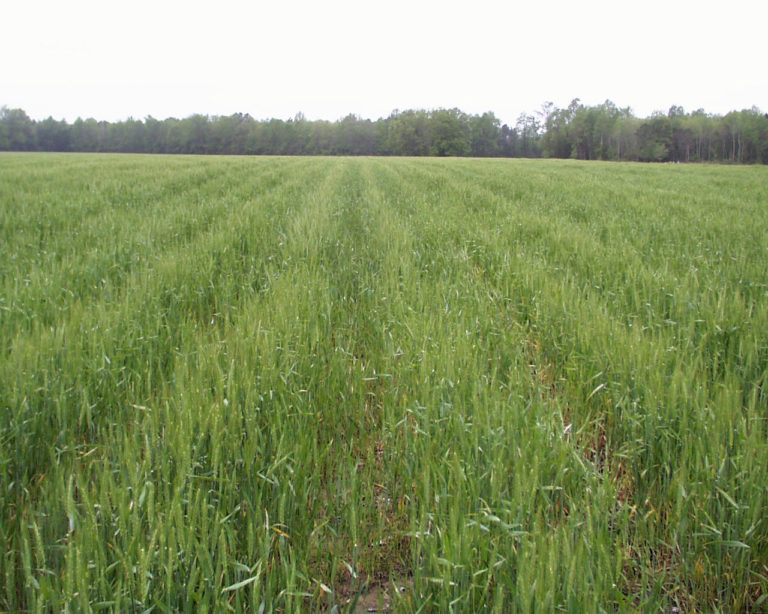
Band placement can save on fertilizer input costs but may result in residual fertilizer band effects. Persistent fertilizer bands can result in uneven second-crop responses and may make the soil sampling process more difficult. Figure 10.8 shows this effect. In prior crop rows, wheat plants were more vigorous. Also, the soil pH and extractable phosphorus were higher in the row than in between rows. Starter fertilizer containing phosphorus had been applied near the row position, while sidedress nitrogen and associated nitrification reactions were concentrated between rows, lowering the pH. Use a random pattern of soil core collection to avoid bias due to over-sampling in the crop row or between rows [36].
Designing a Sampling Strategy for the Entire Rotation
An ideal soil-sampling program allows the producer to select appropriate lime and fertilizer rates and to monitor long-term soil fertility trends. For crop rotations of three years or shorter, sampling once per rotation, prior to the most sensitive crop, may be sufficient. Sample more frequently for soils with low cation exchange capacity (CEC), leaching conditions or low residual fertility. Sample annually to more closely monitor high-value crops. Sample at a consistent depth: typically 4 inches for continuous no-till or other conservation tillage practices that result in minimal soil mixing. Periodically sample the subsoil to a consistent depth: typically 4 to 8 inches to evaluate the fertility and pH of deeper soil. If most fertilizers are banded, blend sample cores taken from the crop row, between rows and intermediate positions to account for variability associated with residual fertilizer.


