Thinking through all the details of your project before you start the work is critical to your success. The following considerations will help you design your project, regardless of which project type you’ve selected.
Experimental design can be complex. We’ll outline the topic in this lesson, but we also recommend you read the “Basics of Experimental Design” section in SARE’s technical bulletin, How to Conduct Research On Your Farm Or Ranch (www.sare.org/research). This is also a good time to find local specialists who can work with you on your project, such as Cooperative Extension staff. Try to find a person who can help with both experimental design and the collection and analysis of data, which we discuss in lessons 6 and 7.
Data
All types of research will involve collecting, recording and managing data. One of the most important decisions you’ll make as you design your project is selecting exactly what data you need to collect to answer your question.
Quantitative data is in the form of numbers. If your question is related to crop yields, you might choose to measure the weight of the entire harvest per acre, or some subset of that. For projects involving some aspect of soil health, you may be collecting samples and sending them to a lab. Lab results will include quantitative measurements of amounts of nutrients or other substances in the soil sample, for example. For market or public opinion data, you may be conducting a survey by phone, online, or in person. Quantitative results from this type of data collection could include the percentage of survey respondents giving certain answers.
By contrast, qualitative data is descriptive information that isn’t expressed in numbers. Qualitative information can include survey or interview responses, photos, or detailed notes.
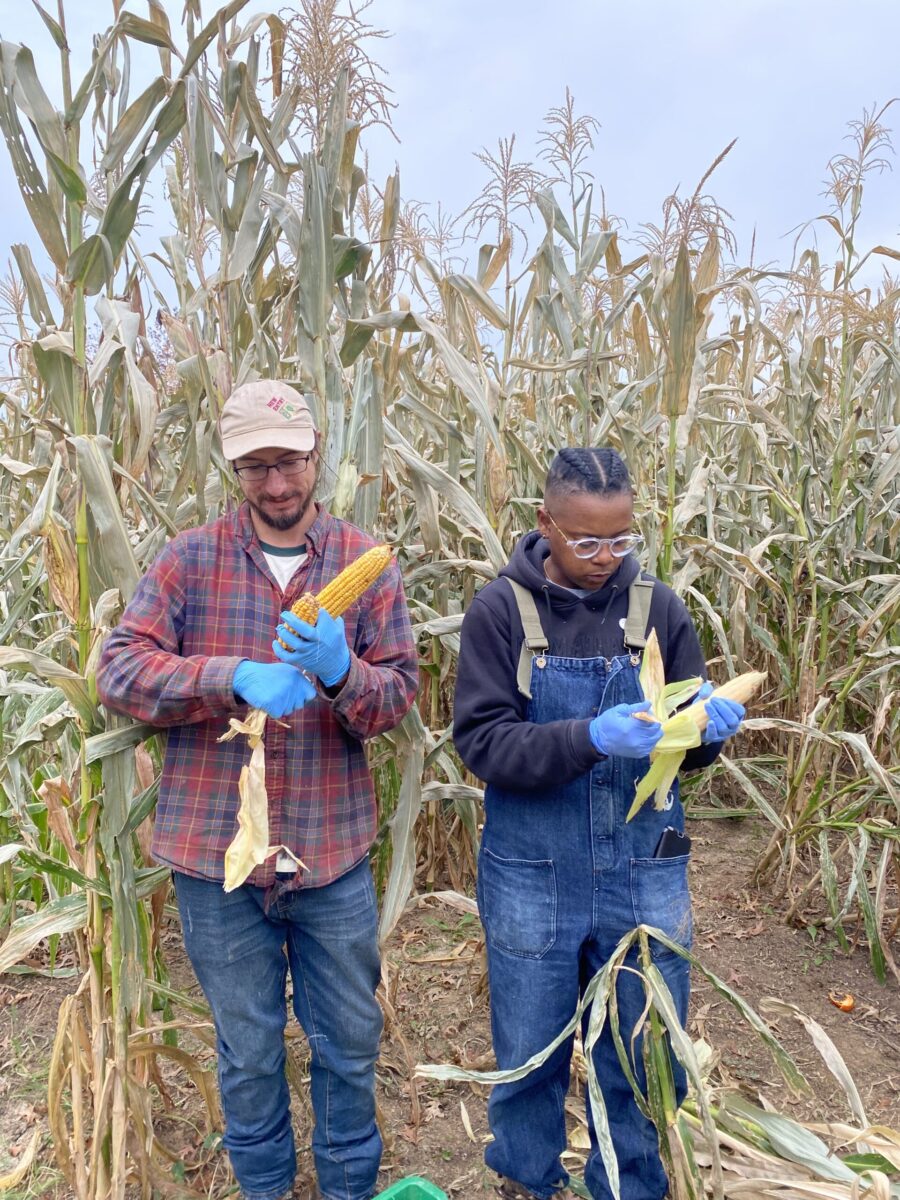
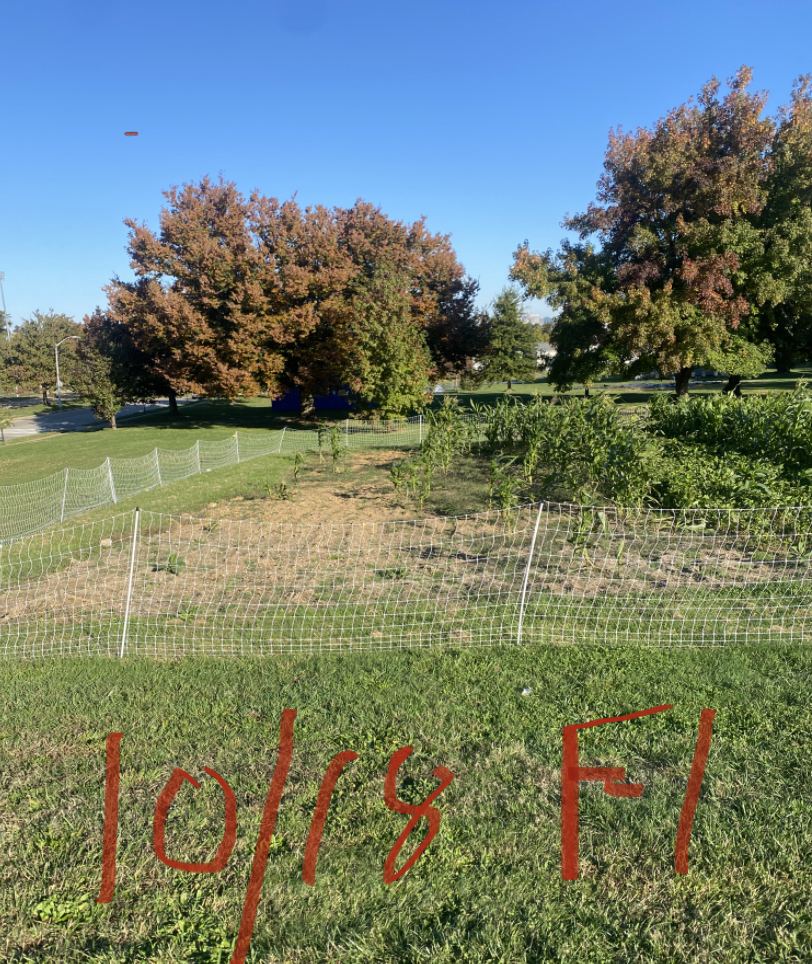
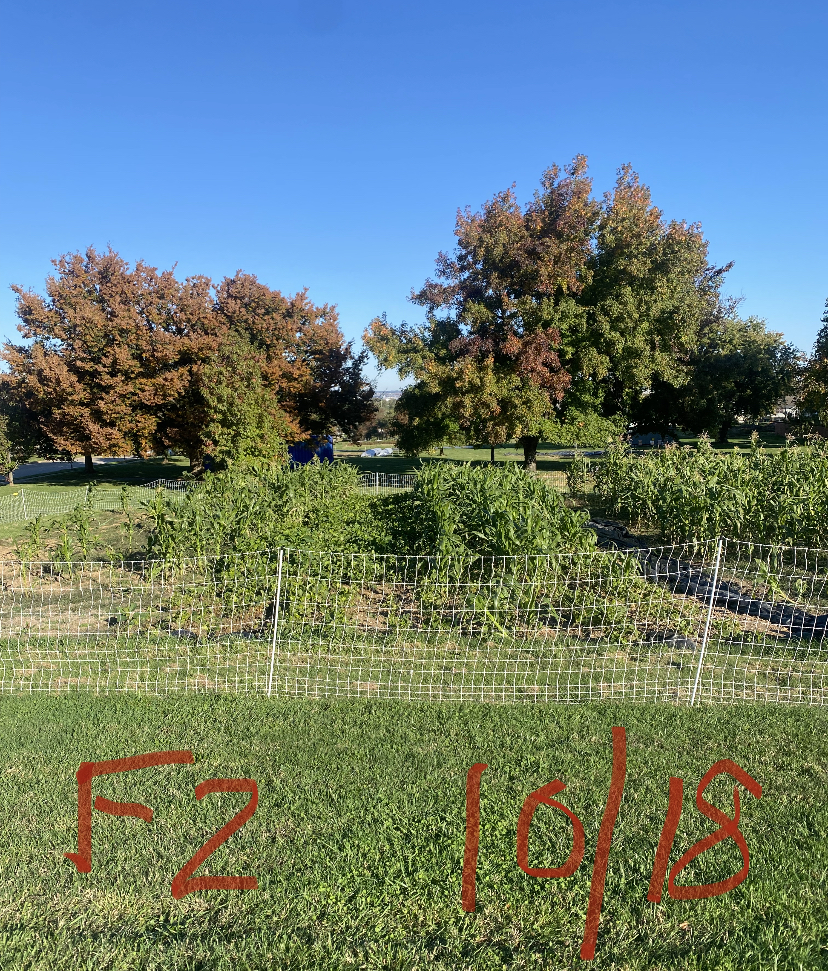

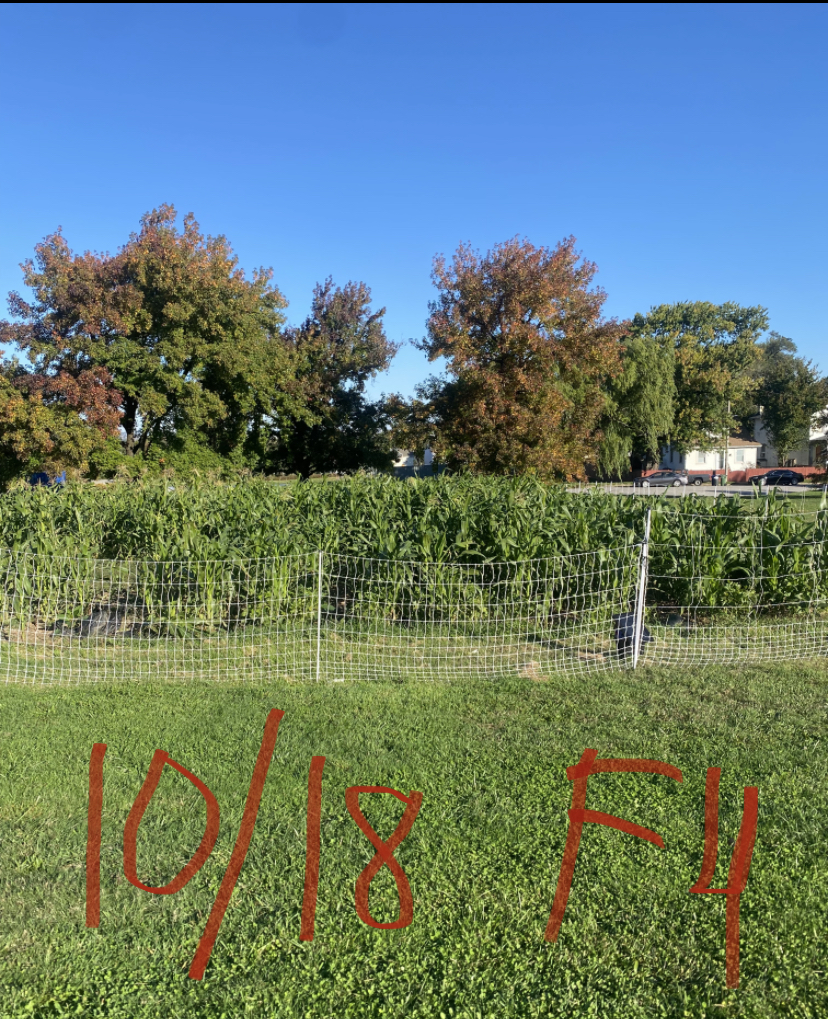
The Baltimore farmers who organized this research project used both qualitative and quantitative data to study the sustainable production of grains, corn and legumes in urban systems. Among other datasets, they measured corn yields after hand harvest (left), and took photos of corn and bean plots as a visual record of crop establishment and growth based on different planting dates (all photos were taken on 10/18 as indicated). Photos courtesy of Denzel Mitchell Jr. (SARE grant FNE22-021)
Whether it is qualitative or quantitative, the data you use should be a reliable indicator of whatever you’re trying to demonstrate. It should be responsive to the processes involved and sensitive enough to demonstrate what you’re trying to show, within the timeframe of your project. For example, dynamic soil properties, such as organic matter content, respond to farming practices more readily than static properties that don’t change with time or treatment, such as soil texture (or, the relative amounts of sand, silt, and clay).
You’ll also need to decide how much data to collect. One way to collect more data is to repeat the same experiment multiple times. This helps control for changes in moisture, temperature, and so on, over the course of the repeated trials. The more repetitions or samples your project includes, the more confident you can be in your conclusions. At the same time, you should carefully consider your limitations in time, space, funding, and so on, and keep your plans realistic. It’s helpful to consider exactly how you’ll use the data you collect; what will it tell you?
Managing Variables
Think about what you’ll learn from the data you collect. This information will help you to understand relationships between the important variables you’ve identified. Whether or not your project involves testing a hypothesis, you need to understand the forces bringing about your results. Could the story emerging from your data be caused by something other than what you’re testing? Are there processes going on that may confuse the story? As you design your project, think about how to eliminate or reduce the effects of unrelated factors.
Also, it’s important to make sure that conditions affecting the various parts of the project are as similar as possible. For example, in livestock experiments where you’re planning to compare different groups of animals, make sure the groups are composed of animals of similar sizes, ages, breeds, sexes, and so on, so that any differences you observe between groups can’t simply be attributed to those factors. For crops, ensure that soil types, slope, watering, plant variety, and other factors are as similar as possible in compared plots (Figure 1).
Figure 1. Examples of How to Design an Experiment
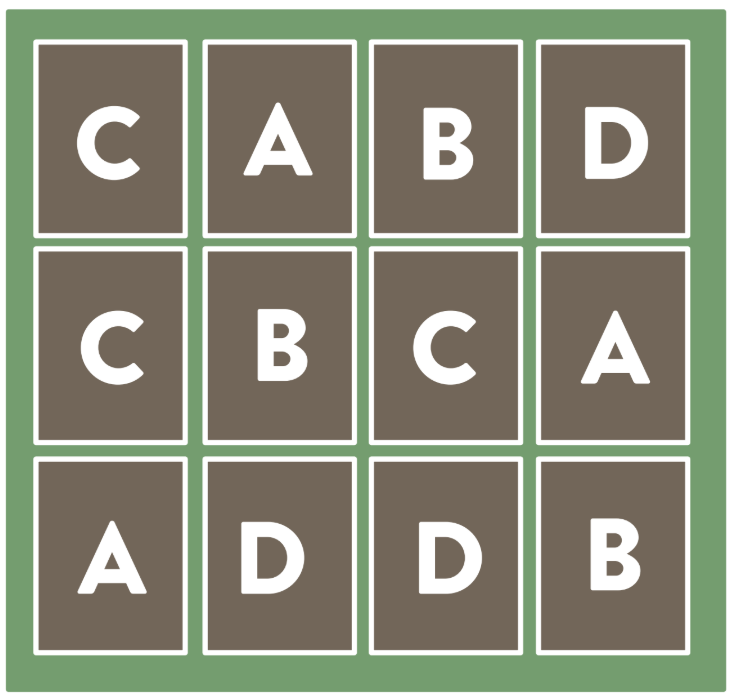
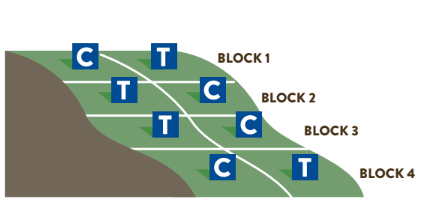
Design the layout of your experimental plots to make conditions as uniform as possible. A completely randomized design (left) works best in tightly controlled situations with uniform conditions. On the right is an example of how to design a project when conditions are variable, in this case due to a sloped field. The field is divided across the slope into blocks, and within each block the plots are placed randomly. This does two things: It makes conditions consistent within each block, and it captures the range of field variability when all blocks are taken together. These examples are from SARE’s technical bulletin; visit www.sare.org/research to learn more about this topic.
In projects involving land areas, plant or animal populations, or human groups, you may be collecting data to understand differences across a population or area. Your data needs to accurately represent whatever you’re sampling, so you’ll want your samples to represent the variability that exists. In general, if the population or area you’re sampling is highly complex or variable, it takes more samples to capture its characteristics. To make sure your data tells a complete and accurate story, you need a good sampling plan. For example, if you’re collecting soil samples in a field, ensure that you sample different areas across the field. Or if you’re surveying people, you might focus on a population that’s within the same generation. There are many different methods you can use to ensure a representative sample of an area, including using random locations or a grid pattern of locations.
Researchers themselves are another important variable that can influence research outcomes. A well-designed project needs to consider ways to manage bias in data collection and interpretation. Simply stated, bias is the tendency of observers to see what they want or expect to see. There are many ways to reduce the influence of bias in data collection, such as assigning data collection to someone unfamiliar with the premise of the research and selecting sampling locations in a systematic way.
Project Design Considerations for Experimental Research
Hypothesis-testing experiments require a rigorously structured design to isolate the variables and produce reliable information. One important way to do this is to divide the experimental area or population into two or more groups and compare how they respond to different conditions. One of the groups or plots is called the treatment, and it receives the input, or treatment, you’re testing. The other group is the control, and it doesn’t receive the treatment. For example, if you’re testing the effect of a feed supplement on animal performance, the treatment group receives the supplement and the control group doesn’t.
The control group is your baseline—eventually you’ll compare the performance of the treatment group to the performance of the control group, allowing you to see if the treatment offers a valuable change. Ideally, other than receiving the treatment, the treatment group, or plot in the case of a crop study, is identical in every way to the control. Many variations on this design are possible, including combinations or levels of treatments, but in all cases the control is an important part of experimental design.
Assignment
The following assignments are provided to help you develop your research project. Later lessons will have you dive deeper into important parts of project design. And remember, we recommend you seek out additional support, through both publications (see www.sare.org/research) and consultants, as you do this assignment.
- Describe your project design, using a slight variation on the classic list of questions:
- WHAT do you plan to do? What sort of experimental design will you use? What data will you collect?
- HOW will you set up and conduct your project? Is there a published method you’ll follow? How many animals, plots, people, or other elements will your project involve?
- WHERE will you conduct your project? Do you have access to the land or facilities you need? Is the layout of the experimental design practical to manage with the equipment you have?
- WHEN does the project begin and end? How long will it take? Is this timeline consistent with constraints, such as the time limits for a grant-funded project? When will you apply your treatments? When will you collect samples, and how frequently will you collect them?
- WHO will do the work involved in this project? Think about who will obtain supplies, set up the project, collect and analyze data, write reports, and conduct any outreach activities, such as field demonstrations. Identify any outside contributors such as laboratories to analyze samples or process images. This person or people will need to balance the project with their regular duties.
- Restate your hypothesis in terms of the specific data you plan to collect.
Assignment Self-Evaluation
- Does your design have an appropriate control? If no control is needed, explain why not.
- What’s the relationship between the data you plan to collect and your hypothesis or objective? Have you selected the most reliable indicator of the effect you want to show?
- Look at every kind of data you plan to collect. Is each piece necessary for determining whether your hypothesis or objectives are supported? If it’s not necessary, collecting it is potentially a waste of your time and money.
- If your data doesn’t show what you think it will, what will you learn from this? Remember not to get discouraged by this outcome—even if it’s not what you expected, you can still learn something that’s potentially of value to you.
- If you run this experiment, could your results be explained by any variables other than what you’re testing? If so, is there a way to adjust your design to minimize the effects of those variables?