The quickest way to rebuild a poor soil is to practice dairy farming, growing forage crops, buying ... grain rich in protein, handling the manure properly, and returning it to the soil promptly.
—J. L. Hills, C. H. Jones and C. Cutler, 1908
There are good reasons why farmers tend to specialize in a few crops or in raising just one species of livestock; it provides economies of scale and fits into the regional agricultural system with its support infrastructure and established marketing channels. A substantial portion of the U.S. poultry, beef and hogs is raised in huge factory-size operations (concentrated animal feeding operations, or CAFOs), but there are many problems associated with these systems. Most such farms import some or all of their feed, sometimes from far away, requiring the supplying crop farms to use large amounts of fertilizers to replace nutrients exported to the animal operations. At the same time the large amounts of manure that accumulate on the animal farms—relative to their land base—may lead to applying quantities of manure that contain more nutrients than needed by crops, resulting in pollution of ground and/or surface waters. (see Chapter 7, “Nutrient Cycles and Flows” for a discussion of patterns of nutrient movement into and out of farms.) Storing large amounts of manure for periodic spreading (as occurs on CAFOs) creates a potential pollution problem and under certain conditions direct contamination of surface waters. The flooding in North Carolina caused by Hurricane Florence in September 2018 was not the first time that hog manure lagoons in that state were breached and surface water was contaminated.
When crops are fed to animals, most nitrogen, phosphorus and potassium contained in the feeds are excreted as waste products. Thus, when animal products are the main sales from the farm, relatively few nutrients (relative to what animals ate) leave the farm. On the other hand, farms that exclusively produce annual grain crops, such as corn, soybeans, wheat and sorghum, or even vegetables, export a lot of nutrients contained in their crops. Another issue is that farms concentrating on production of annual crops usually have no reason to include perennial forage crops in their rotations. Additional equipment is needed to manage the crop, and the sale of forages, bulky by nature, is sometimes difficult. Occasionally there may be a local demand for hay, but most commonly there is little market for it in the wide expanse of regions growing annual crops. Exclusively growing annuals, especially only one or two crops, makes weed control more challenging, deprives the land of the improved soil health of multi-year grasses and legumes, allows disease and insect pests to flourish, and requires large amounts of nitrogen fertilizer to be applied for most crops. Integrating livestock into the farm operation can make it more sustainable but also makes it more complex. If not implemented in the right way it can also increase environmental problems.
Types of Crop-Livestock Farms
There are two general types of integrated livestock-crop farms in which all or nearly all of the animal feed is grown on the farm. There are those that mainly sell animal products and match their animal numbers to the carrying capacity of their land. They produce all or almost all of the feed needed for their own animals. Examples of these farms are beef operations based on pasture grazing and stored hay from the farm (“grass-fed”); hog farms with animals on pasture and supplemental feed produced on the farm; and dairy farms that produce all needed grain and forage, some relying on pastures for seasonal forage needs.
Second, there are diversified farms that raise all the feed for their animals but sell a range of crops and animal products. Combining and integrating the raising of livestock and multiple crops on individual farms has many advantages. Having a number of marketable products provides some protection against the seasonal failure of a single product and the vagaries of market price fluctuations.
Combined crop-and-livestock farms of various types have an inherent advantage for improving soil health. Crops can be fed to animals and manures are returned to the soil, thereby providing a continuous supply of organic materials. For many livestock operations, perennial forage crops are an integral part of the cropping system, thereby reducing erosion potential and helping maintain or increase soil organic matter while improving soil physical and biological properties. Soil health tests conducted on dairy farms consistently show good results for most soil health indicators, although compaction remains a concern. Nevertheless, crop-livestock farms have challenges. Silage harvests do not leave much crop residue, which needs to be compensated for with manure application or cover crops. Minimizing tillage is also important and can be done by injecting the manure or gently incorporating it with aerators or harrows, rather than plowing it under. Soil pulverization can be minimized by reducing secondary tillage, using strip or zone tillage, and establishing the crops with no-tillage planters and seeders. Also, many livestock farms grow row crops with perennial forages and use strip cropping to reduce erosion concerns.
Livestock farms require special attention to nutrient management to make sure that organic nutrient sources are optimally used around the farm and that no negative environmental impacts occur. This requires taking a comprehensive look at all nutrient flows on the farm, finding ways to most efficiently use them and preventing problems with excesses. It also requires matching the numbers of livestock to both the land base and the specific cropping pattern.
Manure
Once cheap fertilizers became widely available after World War II, many farmers, Extension agents and scientists looked down their noses at manure. People thought more about how to get rid of manure than how to put it to good use. In fact, some scientists tried to find out the absolute maximum amount of manure that could be applied to an acre without reducing crop yields. Some farmers who didn’t want to spread manure actually piled it next to a stream and hoped that next spring’s flood waters would wash it away. We now know that manure, like money, is better spread around than concentrated in a few places. The economic contribution of farm manures can be considerable. On a national basis, the manure from 100 million cattle, 120 million hogs and 9 billion chickens contains about 23 million tons of nitrogen (and this doesn’t even include the manure from 324 million layers and 250 million turkeys). At a value of 50 cents per pound, that works out to about $25 billion for just the nitrogen contained in animal manures. The value of the nutrients in manure from a 100-cow dairy farm may exceed $20,000 per year; manure from a 100-sow farrow-to-finish operation is worth about $16,000; and manure from a 20,000 bird broiler operation is worth about $6,000. The benefits to soil organic matter buildup, such as enhanced soil structure, and better diversity and activity of soil organisms, may double the value of the manure. If you’re not getting the full fertility benefit from manures on your farm, you may be wasting money.
Types of Manure
Animal manures can have very different properties, depending on the animal species, feed, bedding, handling and manure-storage practices. The amounts of nutrients in the manure that become available to crops also depend on what time of year the manure is applied and how quickly it is worked into the soil. In addition, the effects of manure on soil organic matter and plant growth is influenced by soil type. In other words, it’s impossible to give blanket recommendations for manure application. They need to be tailored for every situation. And although we are discussing manure as an important component of well-managed, integrated livestock-cropping systems, we will also examine the issues that occur with livestock farms that import a lot of feed and that have insufficient land to utilize all the manure produced in ecologically sound ways. We’ll start the discussion with dairy cow manure from confined spaces like barns and feedlots but will also offer information about the handling, characteristics and uses of other animal manures, as well as grazing systems.
Manure Handling Systems
Solid, Liquid or Composted
The type of barn on the dairy farm farmstead frequently determines how manure is handled. Dairy cow manure containing a fair amount of bedding, usually around 20% dry matter or higher, is spread as a solid. This is most common on farms where cows are kept in individual stanchions or tie-stalls. Liquid manure-handling systems are common where animals are kept in a “free stall” barn and minimal bedding is added to the manure. Liquid manure is usually in the range of 2–12% dry matter (88% or more water), with the lower dry matter if water is flushed from alleys and passed through a liquid-solid separator or if large amounts of runoff enter the storage lagoon. Manures with characteristics between solid and liquid, with dry matter of 12–20%, are usually referred to as semi-solid. Pasture cow manure is unmixed with water or bedding and falls into this category.
Composting manures is becoming an increasingly popular option for farmers. With this, you help stabilize nutrients (although considerable ammonium is usually lost in the process), have a smaller amount of material to spread, and have a more pleasant material to spread, which is a big plus if neighbors have complained about manure odors. Although it’s easier to compost manure that has been handled as a solid, it does take a lot of bedding to get fresh manure to a 20% solid level. Some farmers separate the solids from liquid manure and then irrigate with the liquid and compost the solids. Some separate solids following digestion for methane production and burn the gas to produce electricity or heat. Separating the liquid allows for direct composting of the solids without any added materials. It also allows for easier transport of the solid portion of the manure for sale or to apply to remote fields. For a more detailed discussion of composting, see Chapter 13.
Some dairy farmers have built what are called “compost barns.” No, the barns don’t compost, but they are set up similar to a free-stall barn where bedding and manure just build up over the winter and the pack is cleaned out in the fall or spring. However, with composting barns, the manure is stirred or turned twice daily with a modified cultivator on a skid steer loader or with a small tractor to a depth of 8–10 inches; ceiling fans are sometimes used to help aerate and dry the pack during each milking. Some farmers add a little new bedding each day, some do it weekly, and others do it every two to five weeks. In the spring and fall some or all of the bedding can be removed and spread directly or can be built into a traditional compost pile for finishing. Although farmers using this system tend to be satisfied with it, there is a concern about the continued availability of wood shavings and sawdust for bedding. More recently, vermicomposting has been introduced as a way to process dairy manure. In this case, worms digest the manure, and the castings provide a high-quality soil amendment (see Chapter 13).
Manure from hogs can also be handled in different ways. Farmers raising hogs on a relatively small scale sometimes use hoop houses, frequently placed in fields, with bedding on the floor. The manure mixed with bedding can be spread as a solid manure or can be composted first. The larger, more industrial-scale farms mainly use little to no bedding, with slatted floors over the manure pit, and they keep the animals clean by frequently washing the floors. The liquid manure is held in ponds for spreading, mostly in the spring before crops are planted, and in the fall after crops have been harvested. Poultry manure is handled with bedding (especially for broiler production) or with little to no bedding (industrial-scale egg production).
Storage of Manure
Researchers have been investigating how best to handle, store and treat manure to reduce the problems that come with year-round manure spreading. Storage allows the farmer the opportunity to apply manure when it’s best for the crop and during appropriate weather conditions. This reduces nutrient loss from the manure caused by water runoff from the field, or leaching and gaseous losses. However, significant losses of nutrients from stored manure also may occur. One study found that during the year dairy manure stored in uncovered piles lost 3% of the solids, 10% of the nitrogen, 3% of the phosphorus and 20% of the potassium. Covered piles or well-contained, bottom-loading liquid systems, which tend to form a crust on the surface, do a better job of conserving the nutrients and solids than unprotected piles. Poultry manure, with its high amount of ammonium, may lose 50% of its nitrogen during storage as ammonia gas volatilizes, unless precautions are taken to conserve nitrogen. Regardless of storage method, it is important to understand how potential losses occur in order to select a storage method and location that minimize environmental impact.
Anaerobic digesters are sometimes used to process manure on large livestock farms and to generate biogas, mostly methane. This gas is used on the farm for heat and electricity generation, or possibly off the farm as a fuel for commercial or municipal vehicles. In addition, anaerobic digesters can reduce greenhouse gas emissions, odors and pathogens, and improve air and water quality. They are a major capital investment for a farm, and to make them profitable, farmers typically need to make full use of the energy, carbon credits, tipping fees from external organic wastes, and coproducts of the manure solids. Many digesters may not be economical without subsidies. Digesters separate liquid and solid manure, allowing for separate land application but generally do not change the overall nutrient content. Therefore, they provide some benefits but generally don’t solve problems involving excess nutrients or runoff.
| Table 12.1 Typical Manure Characteristics | ||||
|---|---|---|---|---|
| Dairy Cow | Beef Cow | Chicken | Swine | |
| Dry Matter Content (%) | ||||
| Solid | 26 | 23 | 55 | 9 |
| Liquid (fresh, diluted) | 7 | 8 | 17 | 6 |
| Total Nutrient Content (Approximate) | ||||
| Nitrogen | ||||
| Pounds per ton | 10 | 14 | 25 | 10 |
| Pounds per 1,000 gallons | 25 | 39 | 70 | 28 |
| Phosphate, as P2O5 | ||||
| Pounds per ton | 6 | 9 | 25 | 6 |
| Pounds per 1,000 gallons | 9 | 25 | 70 | 9 |
| Potash, as K2O | ||||
| Pounds per ton | 7 | 11 | 12 | 9 |
| Pounds per 1,000 gallons | 20 | 31 | 33 | 34 |
| Approximate amounts of solid and liquid manure to supply 100 pounds N for a given species of animal | ||||
| Solid manure (tons) | 10 | 7 | 4 | 10 |
| Liquid manure (gallons) | 4,000 | 2,500 | 1,500 | 3,600 |
| Source: Modified from various sources | ||||
Chemical Characteristics of Manures
A high percentage of the nutrients in feeds passes right through animals and ends up in their manure. Depending on the feed ration and animal type, over 70% of the nitrogen, 60% of the phosphorus and 80% of the potassium fed may pass through the animal as manure. These nutrients are available for recycling on cropland. In addition to the nitrogen, phosphorus and potassium contributions given in Table 12.1, manures contain significant amounts of other nutrients, such as calcium, magnesium and sulfur. For example, in regions that tend to lack the micronutrient zinc, there is rarely any crop deficiency found on soils receiving regular manure applications.
The values given in Table 12.1 must be viewed with some caution, because the characteristics of manures from even the same type of animal may vary considerably from one farm to another. Differences in feeds, mineral supplements, bedding materials and storage systems make manure analyses quite variable. Yet as long as feeding, bedding and storage practices remain relatively stable on a given farm, manure nutrient characteristics will tend to be similar from year to year. However, year-to-year differences in rainfall can affect stored manure through more or less dilution.
Forms of Nitrogen in Manures
Nitrogen in manure occurs in three main forms: ammonium (NH4+), urea (a soluble organic form, easily converted to ammonium) and solid organic N. Ammonium is readily available to plants, and urea is quickly converted to ammonium in soils. However, while readily available when incorporated in soil, both ammonium and urea are subject to loss as ammonia gas when left on the surface under drying conditions— with significant losses occurring within hours of applying to the soil surface. Some manures may have half or three-quarters of their N in readily available forms, while others may have 20% or less in these forms. Manure analysis reports usually contain both ammonium and total N (the difference is mainly organic N), thus indicating how much of the N is readily available but also subject to loss if not handled carefully.
Manure varies by livestock animal, mostly due to differences in feeds. Cattle manure is generally balanced in the ammonium/urea versus organic N forms, while nitrogen in swine manure is mostly in the readily available ammonium/urea form. Poultry manure is significantly higher in nitrogen and phosphorus than the other manure types. The relatively high percentage of dry matter in poultry manure is also partly responsible for the higher analyses of certain nutrients when expressed on a wet ton basis.
It is possible to take the guesswork out of estimating manure characteristics as most soil testing laboratories will also analyze manure. Manure analysis is of critical importance for routine manure use and should be a routine part of the nutrient management program on animal-based farms. For example, while the average liquid dairy manure is around 25 pounds of N per 1,000 gallons, there are manures that might be 10 pounds N or less, or 40 pounds N or more, per 1,000 gallons. Recent research efforts have focused on more efficient use of nutrients in dairy cows, and N and P intake can often be reduced by up to 25% through improved feed rations, without losses in productivity. This helps reduce nutrient surpluses on farms.
Effects of Manuring on Soils
Effects on Organic Matter
When considering the influence of any residue or organic material on soil organic matter, there is a key question to ask: How much solids are returned to the soil? Equal amounts of different types of manures will have different effects on soil organic matter levels. Dairy and beef manures contain undigested parts of forages (high in carbon) and may have significant quantities of bedding. They therefore have a high amount of complex substances, such as lignin, that do not decompose readily in soils. Using this type of manure results in a much greater long-term influence on soil organic matter than does a poultry or swine manure without bedding. More solids are commonly applied to soil with solid-manure-handling systems than with liquid systems because greater amounts of bedding are usually included. A number of trends in dairy farming mean that manures may have less organic material than in the past. One is the use of sand as bedding material in free-stall barns, much of which is recovered and reused. The other is the separation of solids and liquids, with the sale of solids or the use of digested solids as bedding. Under both situations much less organic solids are returned to fields. On the other hand, the bedded pack (or compost barn) does produce a manure that is high in organic solid content.
When conventional tillage is used to grow a crop such as corn silage, whose entire aboveground portion is harvested, research indicates that an annual application of 20 to 30 tons of the solid type of dairy manure per acre is needed to maintain soil organic matter (Table 12.2). As discussed above, a nitrogen-demanding crop, such as corn, may be able to use all of the nitrogen in 20 to 30 tons of manure. If more residues are returned to the soil by just harvesting grain, lower rates of manure application will be sufficient to maintain or build up soil organic matter.
The Influence of Manure on Soil Properties
The application of manures causes many soil changes: biological, chemical and physical. A few of these types of changes are indicated in Table 12.2, which contains the results of a long-term experiment in Vermont with continuous corn silage on a clay soil. Manure counteracted many of the negative effects of a monoculture cropping system in which few residues are returned to the soil. Soil receiving 20 tons of dairy manure annually (wet weight, including bedding, equivalent to approximately 8,000 pounds of solids) maintained organic matter and CEC levels, and close to the original pH (although acid-forming nitrogen fertilizers also were used). Manures, such as those from dairy and poultry, have liming effects and actually counteract acidification. (Note: If instead of the solid manure, liquid had been used to supply N and other nutrients for the crop, there would not have been anywhere near as large a beneficial effect on soil organic matter, CEC and pore space.) High rates of manure addition caused a buildup of both phosphorus and potassium to high levels. Soil in plots receiving manures were better aggregated and less dense and, therefore, had greater amounts of pore space than fields receiving no manure.
| Table 12.2 Effects of 11 Years of Manure Additions on Soil Properties | |||||
|---|---|---|---|---|---|
| Application Rate (tons/acre/year) | |||||
| Original Level | None | 10 Tons | 20 Tons | 30 Tons | |
| Organic matter | 5.2 | 4.3 | 4.8 | 5.2 | 5.2 |
| CEC (me/100g) | 19.8 | 15.8 | 17 | 17.8 | 17.8 |
| pH | 6.4 | 6 | 6.2 | 6.3 | 6.3 |
| P (ppm)* | 4 | 6 | 7 | 14 | 14 |
| K (ppm)* | 129 | 121 | 159 | 191 | 191 |
| Total pore space(%) | ND | 44 | 45 | 47 | 47 |
| *P and K levels with 20 and 30 tons of manure applied annually are much higher than crop needs (see Table 21.3A). Note: ND = not determined. Sources: Magdoff and Amadon (1980); Magdoff and Villamil (1977) | |||||
An example of how a manure addition might balance annual loss is given in Figure 12.1. One Holstein “cow year” worth of manure is about 20 tons. Although 20 tons of anything is a lot, when considering dairy manure, it translates into a much smaller amount of solids. If the approximately 5,200 pounds of solid material in the 20 tons is applied over the surface of one acre and mixed with the top 6 inches of soil (2 million pounds), it would raise the amount of soil organic matter by about 0.3%. However, much of the manure will decompose during the year, so the net effect on soil organic matter will be less.
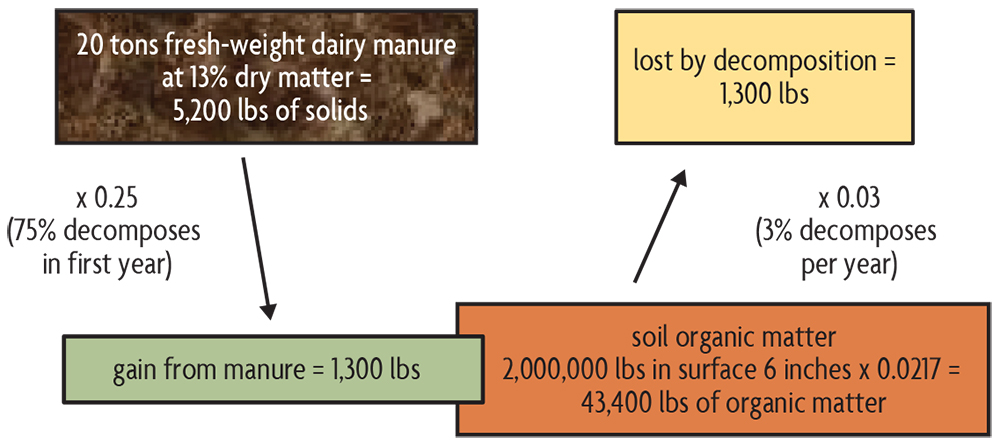
Let’s assume that 75% of the solid matter decomposes during the first year, and the carbon ends up as atmospheric CO2. At the beginning of the following year, only 25% of the original 5,200 pounds, or 1,300 pounds of organic matter, is added to the soil. The net effect is an increase in soil organic matter of 0.065% (the calculation is [1,300/2,000,000] x 100). Although this does not seem like much added organic matter, if a soil had 2.17% organic matter and 3% of that was decomposed annually during cropping, the loss would be 0.065% per year, and the manure addition would just balance that loss. Manures with lower amounts of bedding, although helping maintain organic matter and adding to the active (“dead”) portion, will not have as great an effect as manures containing a lot of bedding material. Overall it is difficult to precisely determine the benefits of the manure, as fields that receive it also tend to have different crops (more perennial forages in dairy systems than grain systems). Still, an analysis of 300 samples from different farms in New York showed that fields with dairy crops that receive manure average 0.5% higher soil organic matter than cash grain crops (corn, soybeans, wheat).
Using Manures
Manures, like other organic residues that decompose easily and rapidly release nutrients, are usually applied to soils in quantities judged to supply sufficient nitrogen for the crop being grown in the current year. It might be better for building and maintaining soil organic matter to apply manure at higher rates, but doing so may cause undesirable nitrate accumulation in leafy crops and excess nitrate leaching to groundwater. High nitrate levels in leafy vegetable crops are undesirable in terms of human health, and the leaves of many plants with high N seem more attractive to insects. In addition, salt damage to crop plants can occur from high manure application rates, especially when there is insufficient leaching by rainfall or irrigation (also with covered ground like high tunnels). Very high amounts of added manures, over a period of years, also lead to high soil phosphorus levels (Table 12.2). It is a waste of money and resources to add unneeded nutrients to the soil, which will mostly be lost by leaching or runoff instead of contributing to crop nutrition. On soils with phosphorus significantly above the optimum level—indicating a long-term farm imbalance of imports and exports of phosphorus—manure applications may need to be based on satisfying crop needs of P instead of N. This may mean exporting a portion of manure from the farm so as to keep soil P from increasing even further.
Manure Application
A common per-acre rate of dairy manure application is 10–30 tons fresh weight of solid manure or 4,000–11,000 gallons of liquid manure. These rates will supply approximately 50–150 pounds of available nitrogen (not total) per acre, assuming that the solid manure is not too high in straw or sawdust and actually ties up soil nitrogen for a while (see discussion below on estimating N availability). If you are growing crops that don’t need that much nitrogen, such as small grains, 10–15 tons (around 4,000–6,000 gallons) of solid manure should supply sufficient nitrogen per acre. For a crop that needs a lot of nitrogen, such as corn, 20–30 tons (around 8,000–12,000 gallons) per acre may be necessary to supply its nitrogen needs. Low rates of about 10 tons (around 4,000 gallons) per acre are also suggested for each of the multiple applications used on a grass hay crop. In total, grass hay crops need at least as much total nitrogen applied as does a corn crop. There has been some discussion about applying manures to legumes. This practice has been discouraged because the legume uses the nitrogen from the manure, and much less nitrogen is fixed from the atmosphere. However, the practice makes sense on intensive animal farms where there can be excess nitrogen, although grasses may then be a better choice for manure application.
Application methods. For the most nitrogen benefit to crops, manures should be incorporated into the soil in the spring immediately after spreading on the surface. About half of the total nitrogen in dairy manure comes from the urea in urine that quickly converts to ammonium (NH4+). This ammonium represents almost all of the readily available nitrogen present in dairy manure. As materials containing urea or ammonium dry on the soil surface, the ammonium is converted to ammonia gas (NH3) and lost to the atmosphere (also causing odor concerns). If dairy manure stays on the soil surface, about 25% of the nitrogen is lost after one day and 45% is lost after four days, but that 45% of the total represents around 70% of the readily available nitrogen. This problem is significantly lessened if about half an inch or more of rainfall occurs shortly after manure application, leaching ammonium from the manure into the soil. Leaving manure on the soil surface is also a problem because runoff waters may carry significant amounts of nutrients from the field. When this happens, crops don’t benefit as much from the manure application, and surface waters become polluted. Some liquid manures—those with low solids content—penetrate the soil more deeply. When applied at normal rates, these manures will not be as prone to losing ammonia by surface drying. However, in humid regions, much of the ammonia-N from manure may be lost if it is incorporated in the fall when no crops are growing. Fall injection of liquid manure, instead of broadcasting on the surface and then disking or plowing, may greatly reduce the loss of ammonia nitrogen.
Other nutrients contained in manures, in addition to nitrogen, make important contributions to soil fertility. The availability of phosphorus and potassium in manures should be similar to what is in commercial fertilizers. (However, some recommendation systems assume that only around 50% of the phosphorus and 90% of the potassium is available.) The phosphorus and potassium contributions contained in 20 tons of dairy manure are approximately equivalent to about 30–50 pounds of phosphate and 180–200 pounds of potash from fertilizers. The sulfur content as well as trace elements in manure, such as the zinc previously mentioned, also add to the fertility value of this resource.
Because half of the nitrogen and almost all of the phosphorus is in the solids, a higher proportion of these nutrients remain in sediments at the bottom when a liquid system is emptied without properly agitating the manure. Uniform agitation is recommended if the goal is to apply similar levels of solids and nutrients across target fields. A manure system that allows significant amounts of surface water penetration and then drainage, such as a manure stack of well-bedded dairy or beef cow manure, may lose a lot of potassium because it is so soluble. The 20% leaching loss of potassium from stacked dairy manure mentioned above occurred because potassium was mostly found in the liquid portion of the manure.
Timing of Applications
Manures are best applied to annual crops, such as corn, small grains and vegetables, in one dose just before soil tillage (unless a high amount of bedding is used, which might tie up nitrogen for a while—see the discussion of C:N ratios in Chapter 9). If the manure is surface applied, this allows for rapid incorporation by plow, chisel, harrow, disk or aerator. If injected, no further tillage may be needed, but application close to planting time is still best, because the possibility of loss by runoff and erosion is reduced. It also is possible to inject liquid manures either just before the growing season starts or as a sidedressing to row crops. Fall manure applications on annual row crops, such as corn, may result in considerable nitrogen loss, even if manure is incorporated. Fall-applied manure in humid climates allows ammonium conversion to nitrate and then leaching and denitrification before nitrogen is available to next year’s crop. A three-year New York study showed about twice the N leaching losses from fall-applied compared to spring-applied liquid manure on corn silage, and the losses were greatest with early fall application when the soils were still warm and allowed for manure decomposition.
Without any added nitrogen, perennial grass hay crops are constantly nitrogen deficient. Application of a moderate rate of manure, about 50–75 pounds worth of available nitrogen, in early spring and following each harvest is the best way to apply manure. Spring applications may be at higher rates, but wet soils in early spring may not allow manure application without causing significant compaction. Manure applications on grass surfaces (when spread uniformly) have very low risk for nitrate leaching, but ammonia losses are higher unless disc injectors or tine aerators are used.
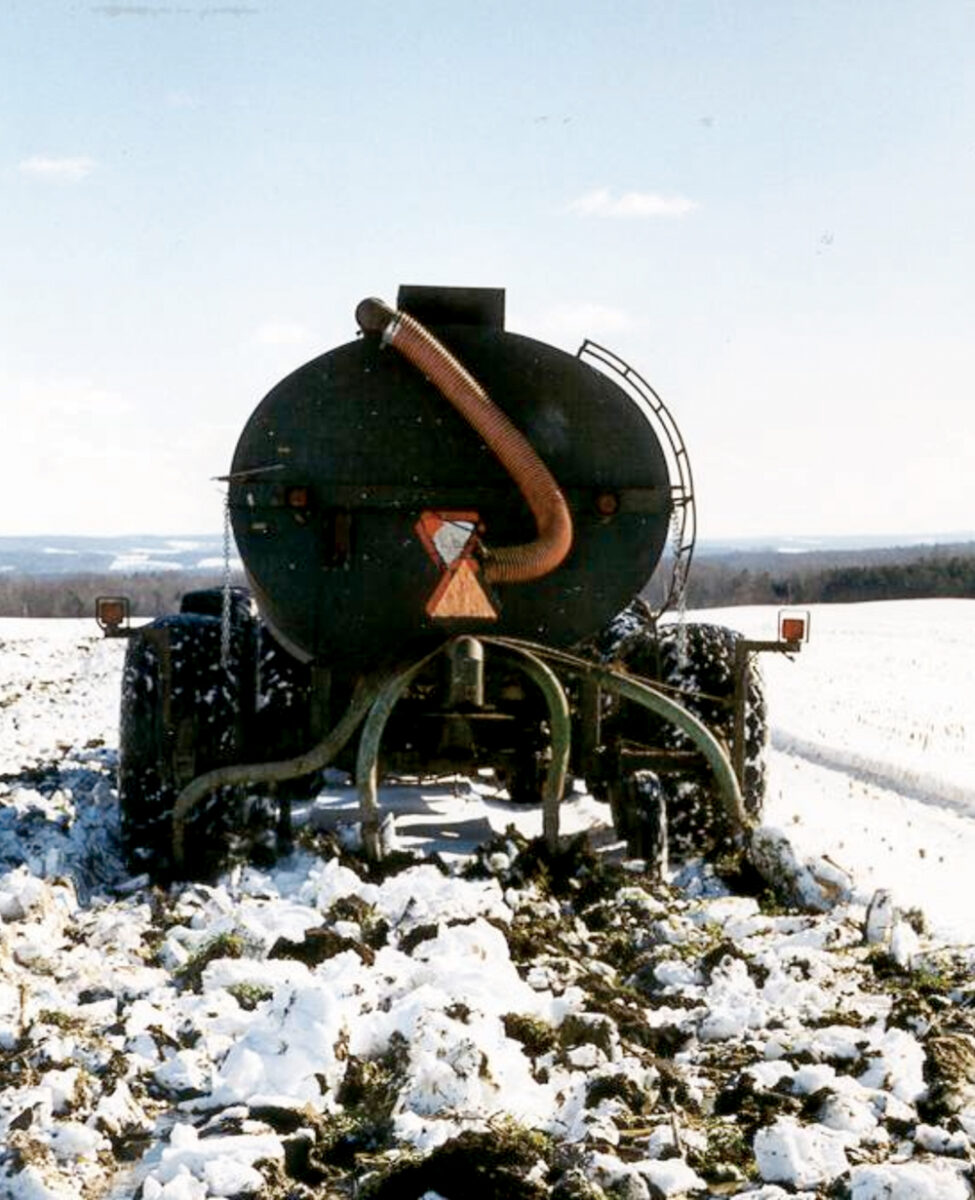
Although the best use of manure is to apply it near the time when the crop needs the nutrients, sometimes time and labor management or insufficient storage capacity causes farmers to apply it at other times. In the fall, manure can be applied to grasslands that don’t flood, or to tilled fields that will either be fall plowed or planted to a winter cover crop. Although legal in most states, it is not a good practice to apply manures when the ground is frozen or covered with snow. The nutrient losses that can occur with runoff from winter applied manure are both an economic loss to the farm and an environmental concern. Ideally, surface applications of manure in winter would be done only on an emergency basis. However, there are windows of opportunity for incorporating and injecting winter applied manure during periods when the soil has a shallow frozen layer, 2–4 inches thick (frost tillage; see Chapter 16). Farmers in cold climates may use those time periods to inject manure during the winter (without runoff concerns) and relieve crunch time for spring application (Figure 12.2).
E. coli 0157:H7
The bacteria strain known as E. coli 0157:H7 has caused numerous outbreaks of severe illness in people who ate contaminated meat and a few known outbreaks from eating vegetables, once when water used to wash lettuce was contaminated with animal manure and once from spinach grown near a cattle farm. This particular bacteria is a resident of cows’ digestive systems. It does no harm to the cow, but, probably because of the customary practice of feeding low levels of antibiotics when raising cattle, it is resistant to a number of commonly used antibiotics for humans. This problem only reinforces the commonsense approach to manure use. When using manure that has not been thoroughly composted to grow crops for direct human consumption, especially leafy crops like lettuce that grow low to the ground and root crops such as carrots and potatoes, special care should be taken. Before planting your crop, avoid problems by planning a three-month period between incorporation and harvest. For short-season crops, this means that the manure should be incorporated long before planting. Although there has never been a confirmed instance of contamination of vegetables by E. coli 0157:H7 or other disease organisms from manure incorporated into the soil as a fertility amendment, being cautious and erring on the side of safety is well justified.
Estimating Manure Nutrient Availability
Nutrient management is challenging when it involves using manure because it is difficult to balance agronomic and environmental objectives. This is especially the case with nitrogen because it is the most dynamic nutrient, one that is easily lost with rain, and its availability from manure is very difficult to predict. Conversely, P, K and most other nutrients stay in the soil and can be assessed through soil testing.
Universities and government agencies offer guidelines for estimating manure N availability, but it is generally recognized that, while they are useful for planning purposes, they are imprecise. The estimated nitrogen availability factors for the northeastern United States are shown in Table 12.3. They reflect the following patterns:
- Spring applications of manure are more efficient than fall or winter applications. The latter can result in considerable losses because the winters in the northeastern United States are wet and can cause N losses. (This also holds for the West Coast and Southeast but is less the case in the midwestern and western United States due to drier winters.)
- The type of manure has a modest impact on N availability.
- Immediate versus delayed incorporation has a big impact on crop N availability because a lot of ammonia is lost when manure is on the soil surface. This effect is especially significant with poultry and swine manure because they contain relatively more ammonium and urea than ruminant manures.
- There is a large benefit of cover crops in conserving the manure N after fall and winter applications. They take up the manure N when it becomes available, store it in their root and shoot biomass, and return it to the soil when they are terminated to grow the following crop.
The estimated N availability values in Table 12.3 are based on total manure N, but they can be improved if the manure analysis separates ammonia-N from organic N. Additional N credits are appropriate if there were manure applications in previous years.
Most farmers follow these guidelines due to nutrient management regulations. However, they are imprecise if they are not based on a manure analysis that shows how much N is actually present. And even when combined with a lab analysis of manure, the guidelines are imprecise because they don’t account for weather factors. In other words, they are reasonable planning tools for manure applications, but the actual N availability may be quite different due to subsequent weather conditions and management practices. Follow-up measurements are therefore recommended, like the pre-sidedress soil nitrate test, weather-driven simulation models, satellite, airplane or drone images, and in-field crop sensors (discussed in Chapter 18). These allow for in-season evaluation of a crop’s N status and a more precise determination of the need for corrective N applications.
| Table 12.3 Estimated Nitrogen Availability from Manure Applications in the Northeast United States | |||||
|---|---|---|---|---|---|
| Nitrogen Availability Factor* | |||||
| Application Season | Target crop | Incorporation Management | Poultry Manure | Swine Manure | Other Manure |
| Spring or summer | All crops | immediate | 0.75 | 0.7 | 0.5 |
| 1 day | 0.5 | 0.6 | 0.4 | ||
| 2–4 days | 0.45 | 0.4 | 0.35 | ||
| 5–7 days | 0.3 | 0.3 | 0.3 | ||
| > 7 days or none | 0.15 | 0.2 | 0.2 | ||
| Early fall | Winter-spring crops | < 2 days | 0.5 | 0.45 | 0.4 |
| 3–7 days | 0.3 | 0.3 | 0.3 | ||
| > 7 days or none | 0.15 | 0.2 | 0.2 | ||
| Summer crops after cover crop | < 2 days | 0.45 | 0.4 | 0.35 | |
| 3–7 days | 0.25 | 0.25 | 0.25 | ||
| > 7 days or none | 0.15 | 0.2 | 0.2 | ||
| Summer crops without cover crop | All methods | 0.15 | 0.2 | 0.2 | |
| Late fall or winter | Winter-spring crops | All situations | 0.5 | 0.45 | 0.4 |
| Summer crops | No cover crop | 0.15 | 0.2 | 0.2 | |
| Cover crop harvested | 0.15 | 0.2 | 0.2 | ||
| Cover crop as green manure | 0.5 | 0.45 | 0.4 | ||
| *The nitrogen availability factor is the N fertilizer equivalent per pound of manure N. Source: Penn State University (table simplified from original source; for illustration only) | |||||
Grazing
We have mostly discussed using manure from livestock that are confined in lots or barns and have forage brought in from fields. Pastures allow animals to graze their own feed and are most appropriate for ruminant animals (cattle, sheep, goats, etc.) that can digest forage crops. Nonruminant animals like chickens and pigs can also be raised on pastures, but they derive little feed from the field and need to be supplied additional feeds such as grains. The benefits are then mostly for animal welfare and health, and perceived improved food quality rather than optimum feed and nutrient management, which many consumers are willing to pay for.
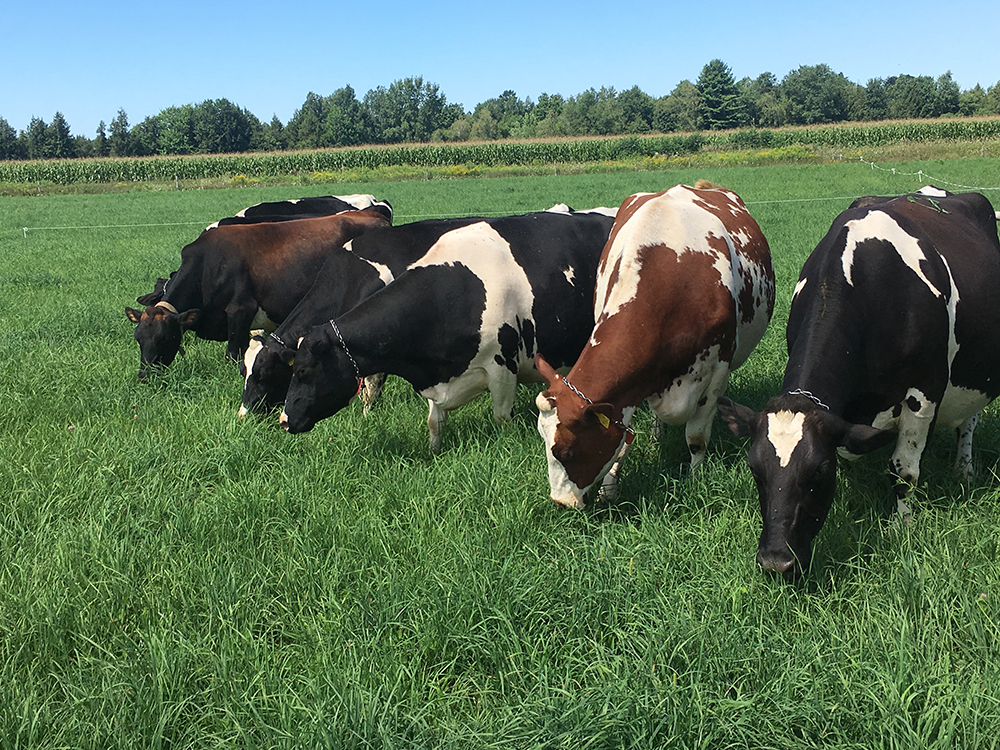
For years animals were grazed in large areas, out on rangeland or on farms, where they might be switched between two pastures during the grazing season. Dairy farmers commonly used one or two “night pastures” with cows turned out after the evening milking. But these continually grazed 0r very infrequently rotated pastures produced poorly as animals ate the regrowth again and again, weakening plants. Plants need to grow to a reasonable size before root reserves can be fully replenished, and continually regrazing early shoot regrowth depletes root reserves, making it harder for the plant to regrow again after grazing. But using what’s sometimes called management intensive grazing (MIG), in which animals are rotated through many pastures and do not re-graze a paddock until plants have sufficiently regrown, has shown great improvement in pasture productivity and animal health. Depending on the season and weather, the rotation cycle can be as short as a week or 10 days and as long as 6–8 weeks. For dairy farms using MIG, cows are turned out to a fresh paddock after each milking (Figure 12.3). Other animals might be moved to a new pasture daily or every few days.
A well-managed grazing system has inherent efficiencies because the harvesting and fertilization require no (or limited) equipment and human labor. It is also attractive to those who are concerned with animal welfare, as it is more in line with the natural living environment for most farm animals. A common counterargument is that animals on pastures expend more energy on foraging compared to confined animals (reducing meat or milk yields) and that the most productive biomass crops, like corn and sorghum, don’t lend themselves well to grazing. But in most cases cows grazing on high-quality, intensively managed pastures result in a lower cost of production once you factor in lower labor and machinery needs for such tasks as cleaning barns, spreading manure, harvesting crops, transporting animals to barns and feeding them out. The use of the newer styles of fencing and electric fence chargers make it easy to quickly set up new grazing paddocks, and once dairy or beef cows are trained to electric fences, a single-strand electric internal fence is enough to contain them in the paddock.
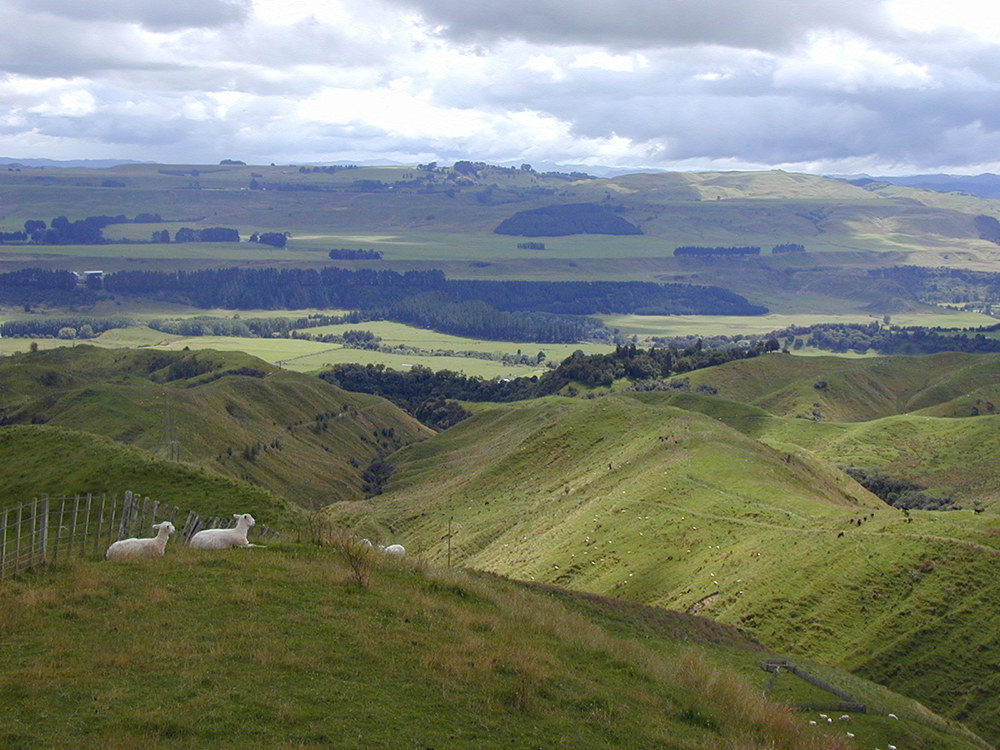
Grazing, especially involving small ruminants like sheep and goats that can handle rough terrain, permits productive use of marginal lands that generally aren’t suitable for intensive crop production. In fact, much of the hillsides of the northeastern United States were pastures stocked with sheep during the 1800s, but due to a shift in agricultural and labor markets were then reforested. But in other countries hillsides are still productively managed as pastures (Figure 12.4).
Well-managed pastures promote good soil health because they combine three beneficial practices: perennial forage crops, absence of tillage and regular manure additions. A soil health study involving a wide range of New York cropping systems confirmed that pasture fields had far better scores than other cropping systems for soil organic matter content, active carbon, protein, respiration, available water capacity and aggregate stability.
Other grazing systems. In addition to management intensive grazing of permanent pastures, there are other grazing systems. Sometimes intensive grazing is taken to an extreme level through mob grazing, where extremely high stocking densities (100,000 pounds of animals per acre) are used for very short time periods (8–12 hours). This approach is used as a soil amelioration technique, where animals suppress or kill poor quality plant species and with their hoofs help to reseed the paddock with more productive species. In some situations animals are allowed to roam over larger rangeland areas but are stocked densely during the night time. The carbon, nutrients and seeds gathered during the day are excreted into the smaller area and provide a significant boost for soil fertility and revegetation (as discussed with “plaggen soils” in Chapter 7). In general, however, pastures need to be managed with careful consideration of the biomass production potential of the land, which is typically defined by rainfall, temperature and soil quality. Overgrazing happens when farmers maintain excessive herd sizes, often based on normal or good growing conditions, during years that experience low rainfall. This causes excessive foraging, weakening or die-off of the pasture plants, and subsequently, soil degradation and further loss of productivity.
Farmers using management intensive grazing normally only sell animal products, not crops. Integrated crop-livestock systems, in which both crops and animal products are sold commercially, are increasingly used in drier regions of traditional grassland like the North American Great Plains. Several systems exist and may all be used on the same farm:
- Grazing annual crop residue works with an annual row crop system where the grain is harvested and the residues are grazed during the dormant periods in the autumn, winter or dry season. Although this does not meet annual feed needs, it reduces feed costs and improves nutrient and carbon cycling. Cattle grazing of corn residue in winter is common in the Great Plains and has been shown to increase soil health and crop yields. In some cases, farmers also leave some of the grain unharvested (corn or sunflowers, for example), enabling forage access for the grazing animals during the winter, even with deep snow.
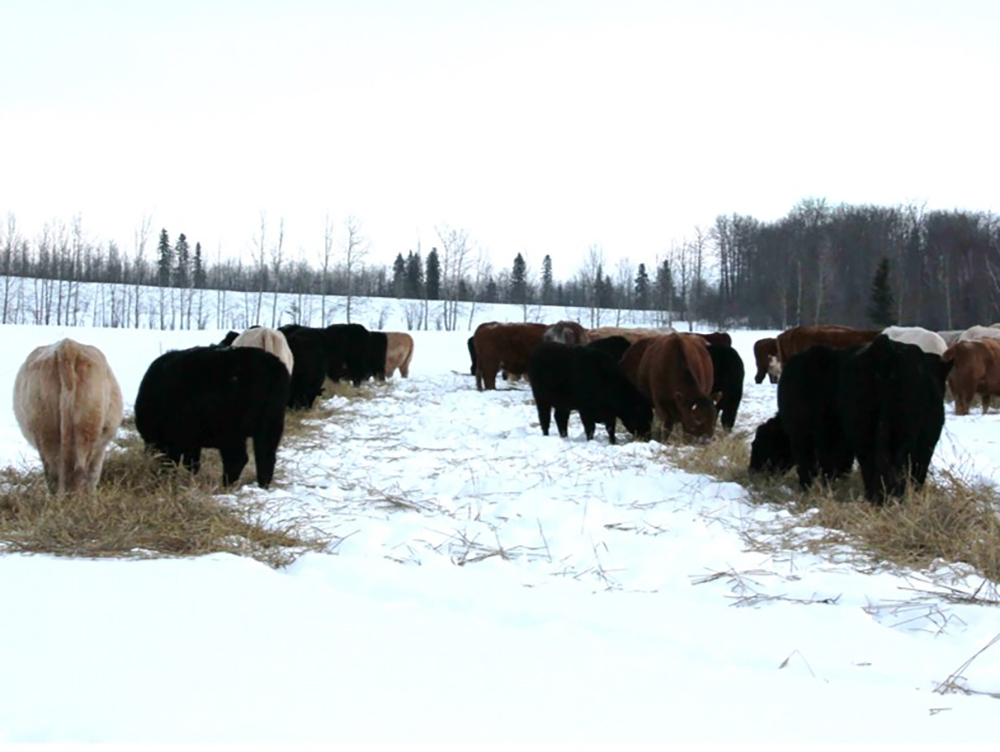
- Swath grazing involves annual crops such as barley and triticale, cut in the autumn. They are left in swaths (heaped rows) for grazing, mostly for beef cattle (Figure 12.5). The grazing is typically controlled through temporary fencing. Swath grazing improves forage accessibility, especially when there is deep snow, by concentrating and stacking the forage into narrow swaths.
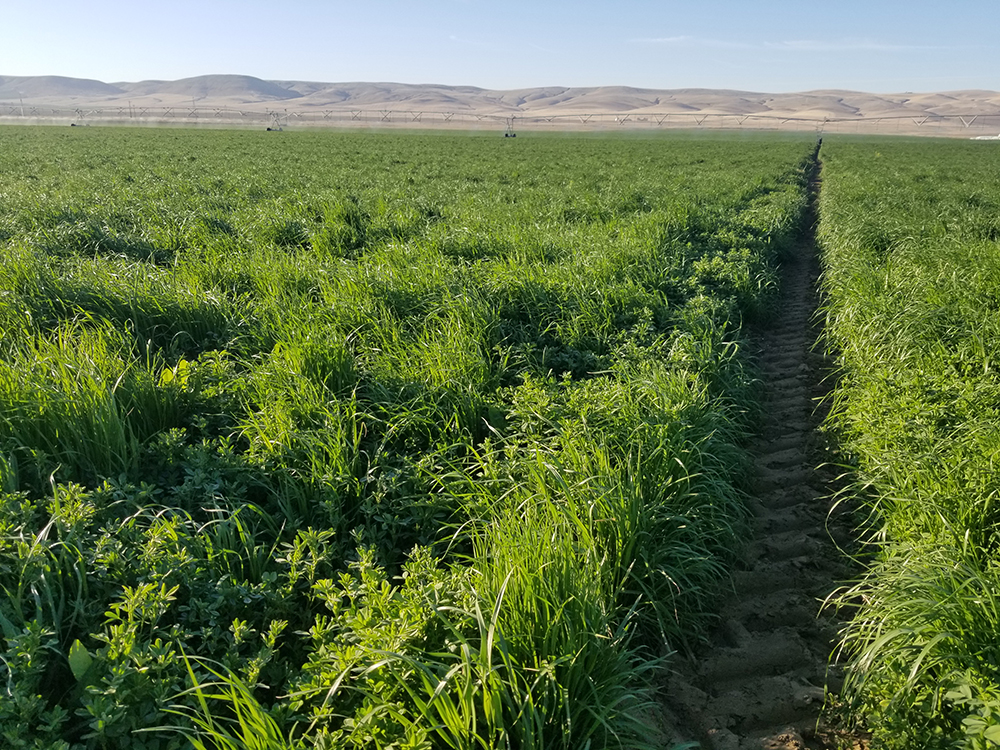
- Grazing annual forages involves livestock grazing on annual or short-season crops, which can also function as cover crops. Cool-season crops (winter wheat, rye or triticale) can be planted in the fall for spring grazing, or planted in the spring (oats, barley, wheat) for late-spring and early summer grazing. Brassicas like turnips, kale and legumes like forage peas are often mixed in. Warm-season annual grasses like sorghum, sorghum-sudangrass and millet can be planted in late spring to provide autumn grazing. These systems can be matched with cash crops after grazing, like the field in Figure 12.6. (This picture was taken in the month of April.) Controlled grazing of cover crops can significantly contribute to high-quality forage and can be used as a means to terminate a cover crop.
- Grazing perennial forage crops that are part of a crop rotation on integrated crop-livestock farms involves raising forages, usually for two to 10 years, that can be either hayed or grazed. One of the great advantages of integrated crop-livestock farms is that they provide a very good reason for growing perennial forages, which considerably enhance soil health.
Full reliance on pastures to provide all the animals’ forage needs is generally not feasible, even with ruminants. Invariably pastures experience periods of limited growth during dry or cold seasons, and additional feed is needed. Sometimes pastures are “stockpiled” (that is, left ungrazed or not hayed) for use when crops aren’t growing. In many cases baled hay has to be supplied from other sources. Most animals also require additional grains for optimum growth. Emergency feed may be required during unusual weather events like drought, high snow or ice.

Figure 12.5. Swath grazing of winter forage in the northern Great Plains. Photo by West-Central Forage Association. Figure 12.6. Mixed winter cover crop used for grazing (Washington State). Photo by Bill Wavrin.
Potential Problems Using Manures
As we all know, there can be too much of a good thing. Excessive manure applications may cause plant growth problems. It is especially important not to apply excess poultry manure because the high soluble-salt content can harm plants. Plant growth can also be retarded when high rates of fresh manure are applied to soil immediately before planting. This problem usually doesn’t occur if the fresh manure decomposes for a few weeks in the soil ,and it can be avoided by using a solid manure that has been stored for a year or more. Injection of liquid manure sometimes causes problems when used on poorly drained soils in wet years. The extra water applied and the additional use of oxygen by microorganisms may mean less aeration for plant roots, and loss of readily plant-available nitrate by denitrification may also be occurring.
Nutrient Imbalances and Buildup
When manures are applied regularly to a field to provide enough nitrogen for a crop like corn, phosphorus and potassium build up to levels way in excess of crop needs (see Table 12.2). It is often mistakenly believed that it results from the fact that manure nutrient ratios are out of balance with crop uptake requirements (especially more P). Nutrient ratios for most manures (Table 12.1) are actually equivalent to a crop’s needs (roughly a 2:1 ratio for nitrogen and phosphorus). If most nitrogen was conserved through good timing and application methods—applied immediately prior to the growing season or in a standing crop, and injected or incorporated—the manure rate necessary to meet crop nitrogen requirement can be substantially lowered and the accumulation of P and K in soil reduced!
Erosion of phosphorus-rich topsoils contributes sediments and P to streams and lakes, polluting surface waters. When soil P levels have already built up and manure applications are restricted based on allowed P additions, as required by some nutrient management plans, N-conserving management means that less fertilizer N will be needed. When very high P buildup occurs, it may also be wise to switch the application to other fields or to use strict soil conservation practices to trap sediments before they enter a stream. Including rotation crops that do not need manure for N, such as alfalfa, allows a “draw-down” of phosphorus that accumulates from manure application to grains. (However, this may mean finding another location to apply manure. For a more detailed discussion of N and P management, see Chapter 19.) When P buildup is a concern, the Phosphorus Index is a tool used to assess the potential for P to move from agricultural fields to surface water. It considers soil and landscape features as well as soil conservation and P management practices in individual fields. These include so-called source factors such as soil test P, total soil P and rate, method and timing of P application. It also considers transport factors like sediment delivery, relative field location in the watershed, soil conservation practices, precipitation, runoff and tile flow/subsurface drainage. This allows a nutrient planner to estimate whether P movement risk is low, medium or high, and to suggest appropriate mitigation measures.
Nutrient Imports and Exports
On integrated crop-livestock farms it is commonly possible to produce all or nearly all the feed needs for the livestock. This helps to keep nutrient imports and exports close to balanced, one of the advantages of integrated farms. But there are different kinds of combinations of cropping and livestock. One extreme is farms that import all the feeds for their animals and then have to somehow get rid of the accumulating manure. More commonly, farms produce most of their own feed but animal numbers exceed the production from the farm’s own land base. These farmers purchase additional amounts of animal feed and may have too much manure to safely use all the nutrients on their own land. Although they don’t usually realize it, they are importing large quantities of nutrients in the feed that then remain on the farm as manures. If they apply all these nutrients on a limited area of land, nutrients start to build up and nutrient pollution of groundwater and surface water is much more likely. It is a good idea to make arrangements with neighbors to use the excess manure. Another option, if local outlets are available, is to compost the manure (see Chapter 13) and sell the product to vegetable farmers, garden centers, landscapers and directly to home gardeners. Even when manure is exported from the farm, if there is just too much manure in a given local region, shipping long distances will become very expensive. New manure treatments (like different types of drying and mass reduction methods) may offer ways to make it more transportable to areas of nutrient and carbon deficits.
Poultry and hogs are routinely fed metals such as copper and arsenic that appear to stimulate animal growth. However, most of the metals end up in the manure. In addition, dairy farmers using liquid manure systems commonly dump the used copper sulfate solutions that animals walk through to protect foot health into the manure pit. The copper content of average liquid dairy manures in Vermont increased about fivefold between 1992 and the early 2000s, from about 60 to over 300 parts per million on a dry matter basis, as more farmers used copper sulfate footbaths for their animals and disposed of the waste in the liquid manure. Although there are few reports of metal toxicity to either plants or animals from the use of animal manures, if large quantities of manure with a high metal content are applied over the years, soil testing should be used to track the buildup.
Another potential issue is the finding that plants can take up antibiotics from manure applied to soil. About 70% of the antibiotics used in animal agriculture ends up in the manure. Although the amounts of antibiotics taken up by plants are small, this is an issue that may be of concern when using manures from concentrated animal production facilities that use considerable amounts of these substances.
Nutrient Losses with Grazing
In grazing systems the animal excrements are directly deposited on the surface (in the case of cattle, colloquially referred to as “cow pies”). Some of the ammonium/urea is lost to the atmosphere as the manure dries, similar to non-incorporated manure from confined animal systems. Overall, this reduces concerns with N leaching, and runoff tends to be low due to high vegetative cover on pastures. But because these cow pies are unevenly distributed, they generate small areas with concentrated nutrients while areas in between the “pies” have less nutrients and may still benefit from additional fertilizer. For this reason, nitrate leaching may still be a concern with intensively managed and fertilized dairy pastures.
Chapter 12 Summary
There are various ways to combine crops and animals into a farming operation, and if carried out well, there are usually numerous advantages to doing so. This is especially the case when the purpose of the farm is to sell multiple products, both crop and animal, which provides a degree of economic security through diversity. Another advantage is the improvement of soil health when establishing pastures (permanent or as part of a rotation) and growing hay crops. Intensively managed grazing systems, one general system of integrating livestock and crops, are very efficient, can be highly productive, and provide multiple benefits by improving soil health through perennial covers and manure applications.
Another advantage of integrating crops and livestock is having access to animal manures, which is useful for building healthy soils and moving nutrients to fields that need them the most. Manures are high in nutrients needed by plants, and they help build and maintain soil organic matter levels. There is wide variability in the characteristics of manures, even from the same species, depending on feeding, bedding and manure handling practice, and it is important to analyze manures to more accurately judge the needed application rates. But some animal-based systems pose great environmental concerns because they do not adequately consider nutrient cycles and potentials for losses after manure application. It is important when using manures to keep in mind the potential limitations, including pathogen contamination of crops that are for direct human consumption; accumulation of potentially toxic metals from high application of certain manures; and overloading the soil with N or P by applying rates that are in excess of needs, as demonstrated by soil test and known crop uptake.
A Case Study, Darrell Parks
Manhattan, Kansas
Even if Darrell Parks didn’t like working with hogs, he would still raise them on his 275-acre farm in the Flint Hills of Kansas, if only for the manure that makes up a key part of his soil fertility program. Each year, Parks’ farm raises and finishes about 500 hogs from 40 sows, while also producing corn, milo, wheat, soybeans and alfalfa. He sells his hogs to the Organic Valley cooperative and as pork cuts at a local farmers’ market.
Parks spot-treats his land with hog manure to help areas needing extra fertility. He likes how targeting problem areas with thicker applications of manure corrects soil micronutrient deficiencies. “Manure from the hogs doesn't supply all my fertility needs, but with cover crops and organic fertility additions that are more available now I have been able to maintain decent yields,” says Parks, who received a grant from USDA’s Sustainable Agriculture Research and Education (SARE) program to hone his use of manure on cropland. He was successful in that endeavor, and his cropland has been certified organic since 1996.
Parks’ crops are raised mainly in two rotations. In one rotation, alfalfa is grown for three years, followed by a year each of corn and soybeans before returning to alfalfa. In the other, he plants Austrian winter peas in the late fall following wheat harvest. The peas, incorporated in the spring, are followed with a cash crop of milo or soybeans prior to a fall- or spring-planted wheat crop.
To ensure a sufficient nutrient supply for his wheat crops, Parks typically treats his wheat fields with liquid manure at a rate of approximately 660 gallons per acre. He collects this manure in a concrete pit adjacent to a building where sows are housed for brief periods during breeding or when being sold. The liquid manure, for which he does not typically obtain a nutrient analysis, “catches a lot of rainfall and is fairly dilute—[essentially] high-powered water,” he says. “I avoid wet conditions when spreading and try to hit the wheat in March or April during a dry period on a still day, before [the wheat] is too big.”
Parks sometimes lets older sows out to pasture on some of his fields, where they spread their own manure. He cautions, however, against pasturing young pigs on alfalfa. “You’d think they’d balance their ration better,” he says, “but they don’t—they overeat.”
For most of their lives, Parks’ hogs are raised on half of a 10-acre field. He plants the remaining five acres to corn. Once the corn is harvested, he moves the hogs and their pens over to the “clean ground” of corn stubble. “Going back and forth like this seems to work well in keeping the worms down,” he says. And he notes that the 50–60 pounds of N per acre put down with the hogs’ manure helps grow “some pretty good corn” in that field each year.
Parks notes that his tillage regime, on which he is dependent for weed control in his organic system, makes maintaining and improving his soil organic matter content especially challenging. That’s why he remains committed to integrating the use of both animal and “green” manures on his farm.
Striving for economic sustainability, Parks is constantly weighing the pros and cons of becoming more self-sufficient by raising his own feed for the hogs versus taking advantage of the price premiums for organic grains.
“It’s a hard decision,” he says. “Right now, if I cut down on hogs, maybe it would be better economically. But if I get out [of raising hogs entirely], it’s not easy to get back in.”
For now, he is betting that over the longer term, he’s better off keeping his hogs. “A lot of people don’t like the idea of how pigs are raised” within a conventional operation, he says. “We’re meeting [the demand of] a niche market in its infancy that is sure to grow.”
Chapter 12 Sources
Cimitile, M. 2009. Crops absorb livestock antibiotics, science shows. Environmental Health News. http://www.environmentalhealthnews.org/ehs/news/antibiotics-in-crops.
Di, H.J. and K. Cameron. 2007. Nitrate Leaching Losses and Pasture Yields as Affected by Different Rates of Animal Urine Nitrogen Returns and Application of a Nitrification Inhibitor—A Lysimeter Study. Nutrient Cycling in Agroecosystems 79(3): 281–290.
Elliott, L.F. and F.J. Stevenson, eds. 1977. Soils for Management of Organic Wastes and Waste-waters. Soil Science Society of America: Madison, WI.
Endres, M.I. and K.A. Janni. Undated. Compost Bedded Pack Barns for Dairy Cows. http://www.extension.umn.edu/dairy/Publications/CompostBarnSummaryArticle.pdf.
Harrison, E., J. Bonhotal and M. Schwarz. 2008. Using Manure Solids as Bedding. Report prepared by the Cornell Waste Management Institute (Ithaca, NY) for the New York State Energy Research and Development Authority.
Kumar, S., H. Sieverding, et al. 2019. Facilitating Crop-Livestock Reintegration in the Northern Great Plains. Agronomy Journal 111: 2141–2156.
Madison, F., K. Kelling, J. Peterson, T. Daniel, G. Jackson and L. Massie. 1986. Guidelines for Applying Manure to Pasture and Cropland in Wisconsin. Agricultural Bulletin A3392. Madison, WI.
Magdoff, F.R. and J.F. Amadon. 1980. Yield trends and soil chemical changes resulting from N and manure application to continuous corn. Agronomy Journal 72: 161–164. See this reference for dairy manure needed to maintain or increase organic matter and soil chemical changes under continuous cropping for silage corn.
Magdoff, F.R., J.F. Amadon, S.P. Goldberg and G.D. Wells. 1977. Runoff from a low-cost manure storage facility. Transactions of the American Society of Agricultural Engineers 20: 658–660, 665. This is the reference for the nutrient loss that can occur from uncovered manure stacks.
Magdoff, F.R. and R.J. Villamil, Jr. 1977. The Potential of Champlain Valley Clay Soils for Waste Disposal. Proceedings of the Lake Champlain Environmental Conference, Chazy, NY, July 15, 1976.
Penn State Extension. 2019. The Agronomy Guide. https://extension.psu.edu/the-penn-state-agronomy-guide.
Pimentel, D., S. Williamson, C.E. Alexander, O. Gonzalez-Pagan, C. Kontak and S.E. Mulkey. 2008. Reducing energy inputs in the US food system. Human Ecology 36: 459–471.
van Es, H.M., A.T. DeGaetano and D.S. Wilks. 1998. Space-time upscaling of plot-based research information: Frost tillage. Nutrient Cycling in Agroecosystems 50: 85–90. van Es, H.M., J.M. Sogbedji and R.R. Schindelbeck. 2006. Nitrate Leaching under Maize and Grass as Affected by Manure Application Timing and Soil Type. J. Environmental Quality 35: 670–679.