As both the understanding of soil as a living system and the interest in improving soil health increase, the need to reliably evaluate soil health is becoming more apparent. Observation and measurement can help track changes at the same location, allowing you to, for example, compare baseline conditions with conditions present after a few seasons of farming using practices aimed at increasing soil biodiversity. In addition, it may be useful to compare soil health between fields where management methods differ, such as in the use of tillage, cover crops, nutrient or grazing management, or crop rotations.
There are many possible measures of soil health, ranging from biological indicators like the abundance and diversity of soil organisms to various chemical and physical soil characteristics. No single indicator captures all soil functions, and using multiple indicators provides a more complete picture of soil health.
Because soil is a living, connected matrix with physical structure, roots, channels, and moisture, temperature, and light gradients, the most accurate and meaningful way to measure soil health is to keep the soil sample as intact as possible. The best way to do this is to make direct assessments in the field. Improvement in real soil function can only be measured when the soil ecosystem in its natural state is included in the assessment. It can be helpful to evaluate unmanaged soil of the same type that has a long history of not being disturbed, such as soil that exists in a fencerow or field border. This can provide an idea of the potential for soil health improvement. This chapter outlines several soil health assessment methods that you can use in the field. Since this isn’t always possible, we also include methods for lab testing.
On-Farm Observations of Organisms
Soil organisms provide a biological indication of soil health and provide a sense of how complete and complex a soil community is—which top predators, prey, herbivores and other functional groups are present and in what proportions. One way to measure changes in soil health and function is to begin by collecting and counting these groups at a baseline point in time, continue doing so for several seasons or years after you implement soil health management practices, and then compare the results. The methods here—using pitfall traps or performing Berlese funnel surveys—can be followed with handmade equipment and traps.
Pitfall Traps
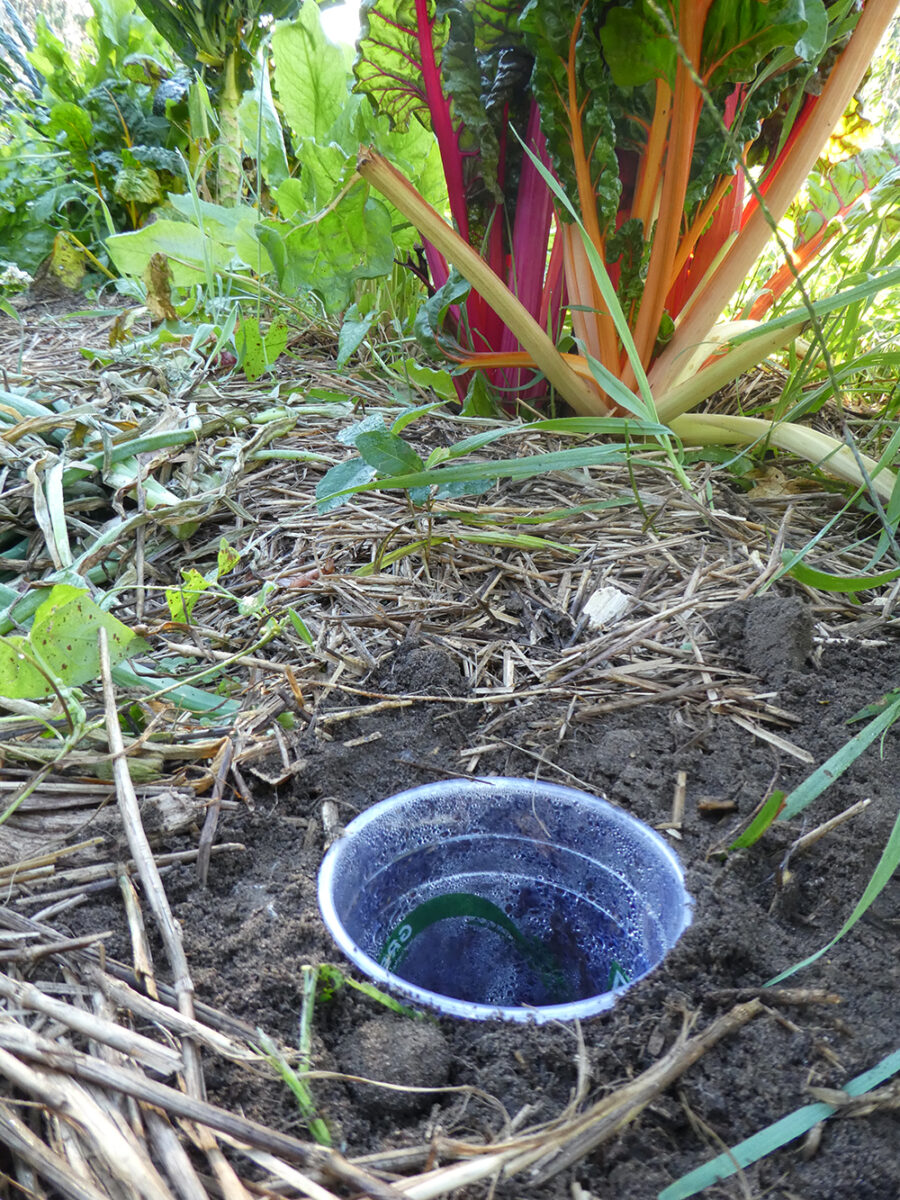
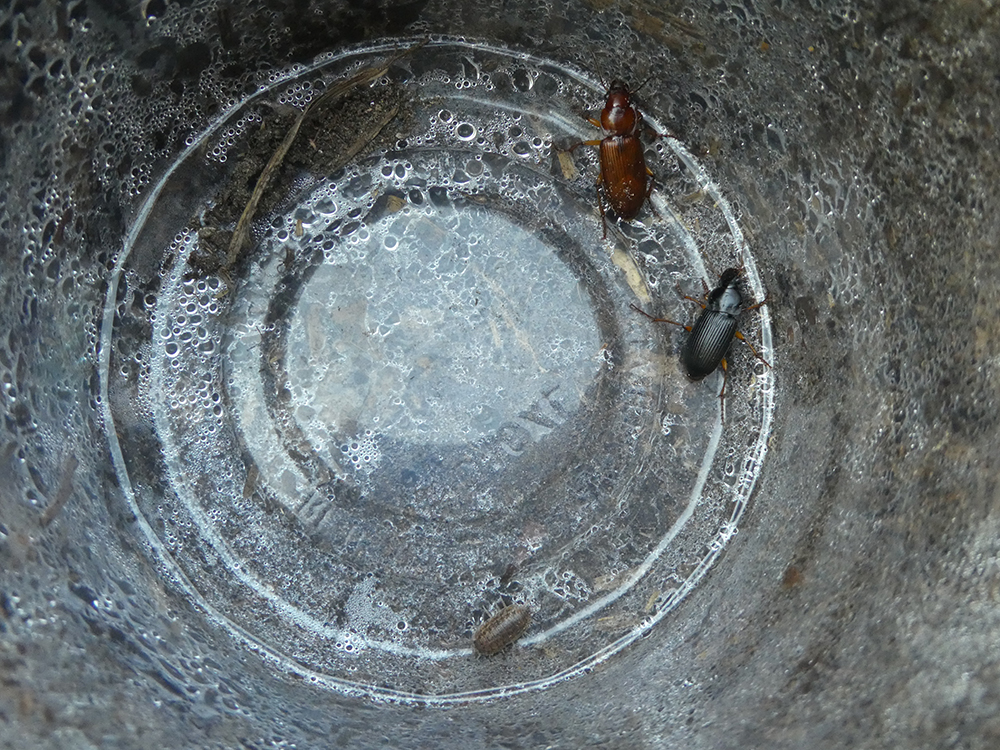
A pitfall trap catches animals, mostly invertebrate macrofauna, that move across the soil surface. Follow these steps to construct and use a pitfall trap:
- Think about timing. Pitfall traps should be used during the growing season when soil animals are most active. Avoid days when rain is likely because rainwater can fill up and overflow the traps, making them temporarily ineffective.
- Choose the sampling sites. You could choose sampling sites at the same location to establish a baseline (before changes in soil management practices) and measure changes after you institute beneficial practices, such as no-till methods or cover cropping. To do this, compare the same site at the same time of year under similar weather conditions. You could also choose several sites within the same field at the same time to illustrate the effect of vegetative cover and management practices on the presence and activity of soil animals. To do this, you could place one site in perennial vegetation beyond the field edges; another site in the field, near the edge; and another site in the field far from the edge.
- Gather the needed supplies. For each site, gather:
- A plastic or metal container (e.g., a plastic drinking cup or a yogurt container) that is approximately 4 to 6 in. (10 to 15 cm) in diameter and 3 to 5 in. (8 to 12 cm) deep;
- Water or killing preservative,* such as ethanol (70%) and glycerol (30%), to nearly fill the container;
- A cover, such as a plastic plate, that is several inches wider than the container in order to exclude rain and other falling debris;
- Wire stakes and duct tape to attach the cover;
- Tools to dig a pit for the container; and
- Flags, ribbon or other marketing to relocate the trap after a sampling period.
- At each sampling site dig a small hole in the soil the size of the container. Place the container in the hole, with the top of the container even with the soil surface. Fill the container with a few inches of the killing preservative. Using wire stakes, place the cover over the container but elevated a few inches above the soil surface. Mark with flags.
- Return after 24 hours, or two or three days, depending on weather, temperature and the activity of soil animals. Remove the traps. Collect the contents of the container, rinse them with water, dry, identify and count. Record the results—the number of insects in each functional group (i.e., predator, decomposer, pest, etc.)—to compare with other locations or after changes in soil health management practices.
*For a no-kill method, use a dry, inescapable container as described above, check the trap within 24 hours of setting it, and then empty it and release the soil fauna after recording what you find.
See the Xerces guide Beneficial Insects for Natural Pest Control: Soil Scouting for template data sheets.
Berlese Funnel Surveys
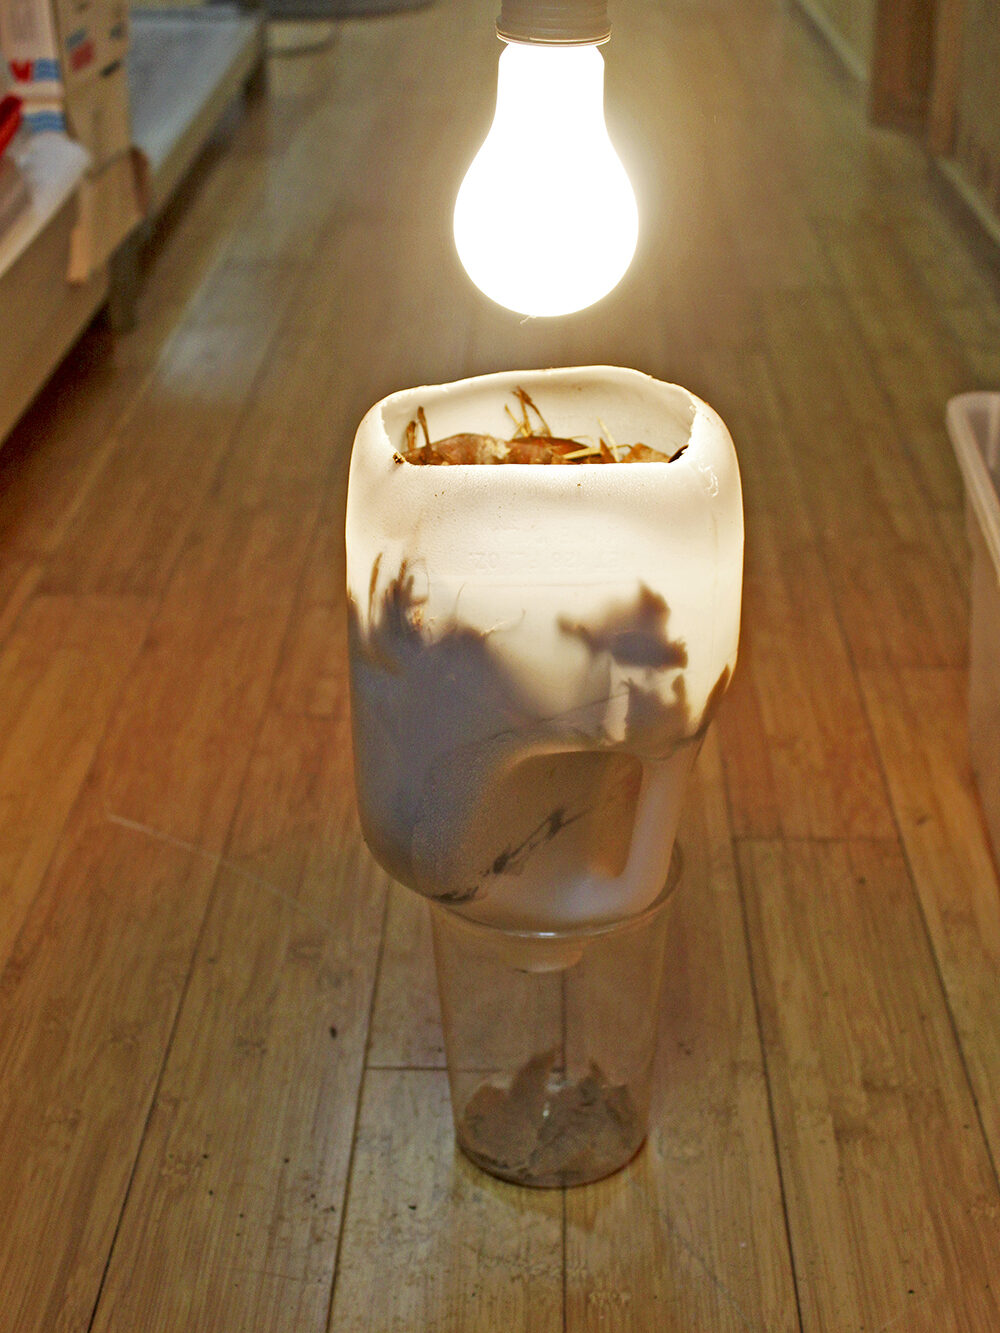
Berlese funnels (also known as Tullgren funnels) represent a simplified method of surveying mobile soil-dwelling organisms, especially small arthropods such as mites, springtails and small insects. In this method, a shallow soil or leaf litter sample is collected and placed under a light. Over a period of days (or hours for small samples and funnels), as the light source warms and dries the soil sample, organisms move away from the light and heat and into a trap below. This can be built from household materials and set up indoors, at the farm or in an office. Follow these steps to construct and use a Berlese funnel:
- Collect two standardized soil samples, one from a crop field and one from a nearby control site. Examples of control sites include fallow field borders, forest or hedgerow understories, or other natural landscapes within the farm landscape that are protected from disturbance—and from pesticide runoff and drift, and excess nutrient runoff (e.g., non-grazed or cultivated areas consisting of permanent vegetation). Soil samples should be collected from the top 2 in. (5 cm) of the soil surface and ideally will include some surface thatch, vegetation or crop debris. To collect samples, use a 16-ounce steel food can with both ends removed (to create a hollow cylinder). Press the can into the soil to a depth of 2 in. (5 cm), extracting a shallow core sample.
- Place the core samples into plastic funnels of roughly the same diameter, with a hardware cloth screen suspending the core sample above the bottom of the funnel.
- Support the funnels on small collection jars that fit closely around the funnel (so that specimens cannot escape from any space around the mouths of the collection jars). If desired, the collection jars can be partially filled with rubbing alcohol (ethyl or isopropyl) to demobilize and preserve specimens.
- Finally, suspend a weak heat lamp or incandescent light bulb 3.94–7.87 in. (10–20 cm) above each funnel, and turn it on to slowly warm the soil sample over a 48-to-72-hour period. During this time, soil organisms accustomed to the cool, moist conditions of soil will move lower into the funnel, eventually falling into the collection jar below. Following this extraction period, examine the collected specimens with a standard dissecting microscope at the highest available power. Simple surveys of soil organisms can be conducted using gridded petri dishes.
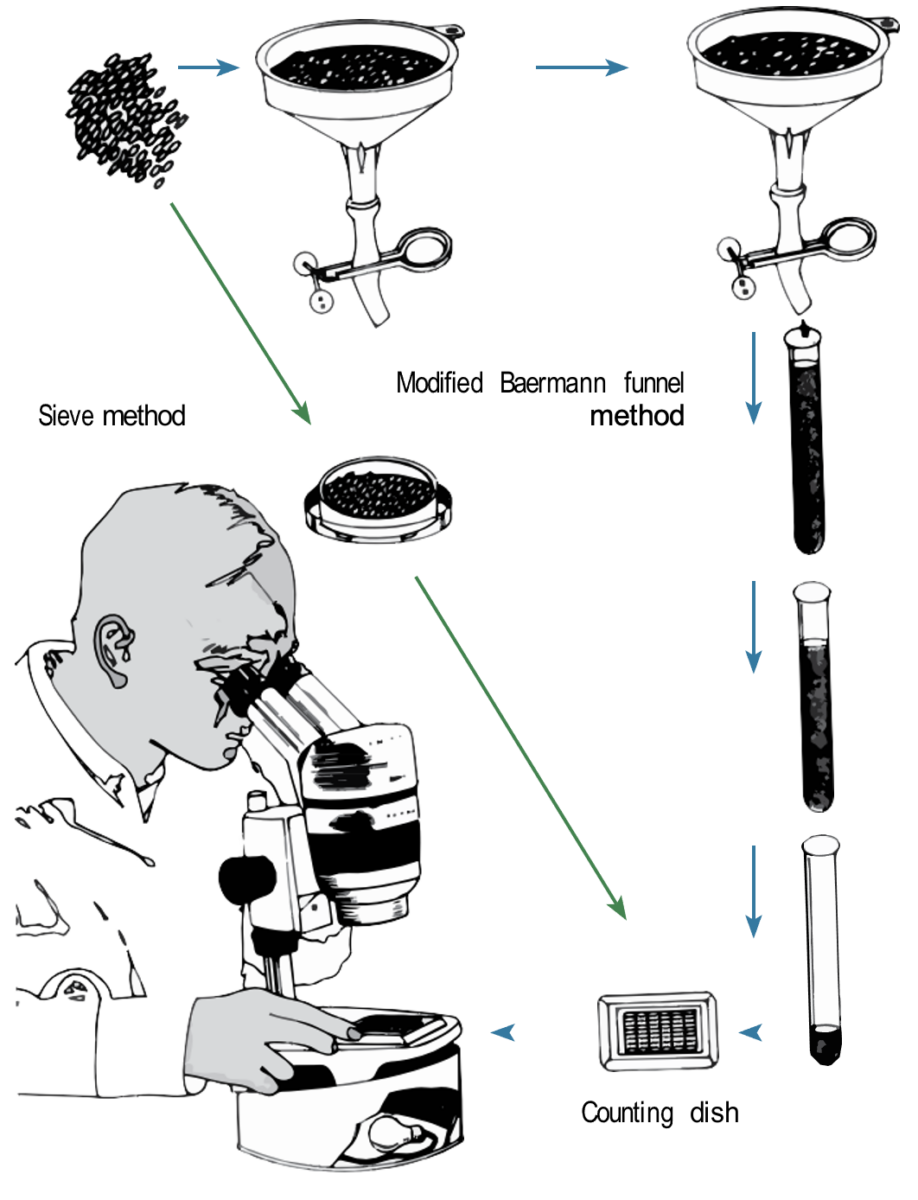
Baermann Funnel Surveys
Another type of funnel method is the Baermann funnel survey. Baermann funnels are used to collect nematodes from a soil sample using a funnel, paper filter and water. A dissecting microscope is needed to identify and count the active nematodes from the sample. These funnels can be used to examine other creatures of water films—for example, rotifers, protozoa and tardigrades.
Field Observations of Soil Characteristics
There are several ways to measure soil characteristics that are relevant to soil health. In-field methods are useful for observing intact, in situ soil function and for comparing before and after management changes. Conventional measures of the physical and chemical properties of soil are relevant to evaluating soil health, but newer methods for measuring biological properties of soil are available or in development. Some examples of in-field measurements are:
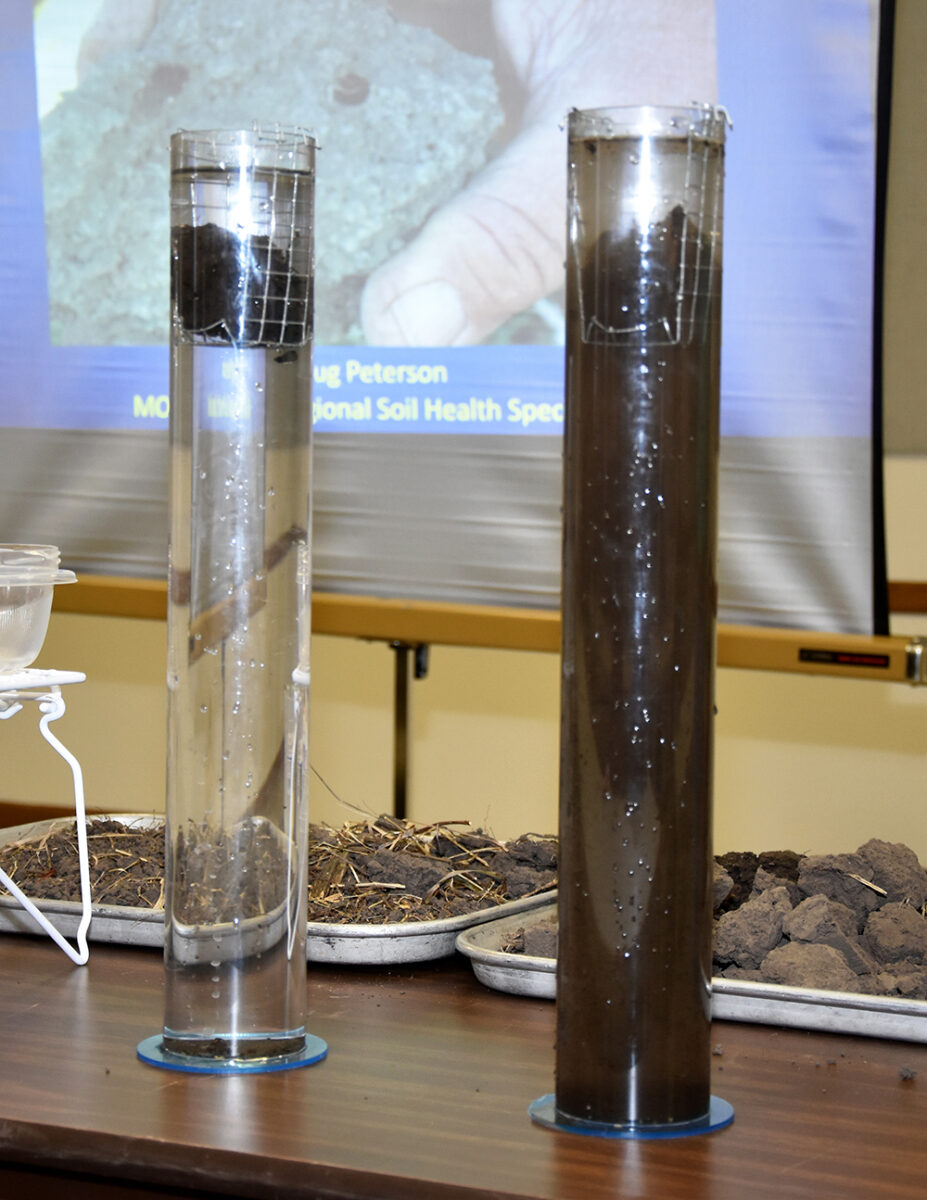
Slake Test
The slake test evaluates the stability of soil aggregates when they are exposed to water. The stability of aggregates in most soils is determined by the soil texture, types of clay, iron content, organic matter and populations of microbes. The hyphae and spores of arbuscular mycorrhizal fungi living in close association with plant roots produce a range of glue-like proteins. In soils, these proteins produce soil aggregates that are not easily eroded when exposed to rain events or flooding. Because more biologically active soils produce more of these natural glues, the slake test provides a convenient process for visually demonstrating the relative microbial richness of soils under different management systems.
To conduct a slake test:
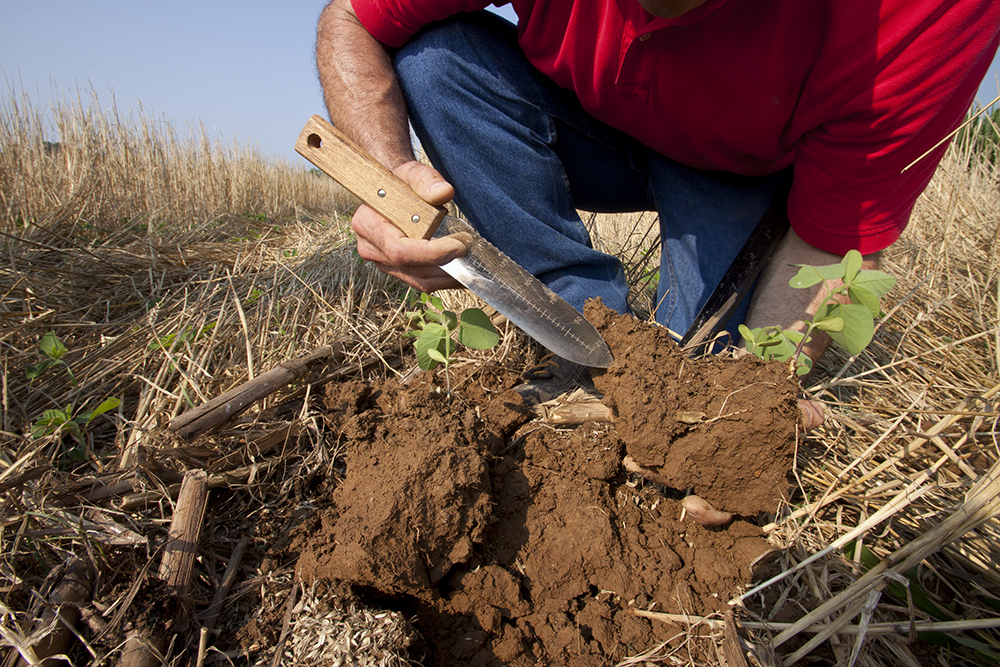
- Collect two soil aggregates, roughly 2–3 in. (5.1–7.6 cm) in diameter, from a crop field and from a nearby control site. Typical control sites include fallow field borders, forest or hedgerow understories, or other natural landscapes within the farm landscape that are protected from disturbance—and from pesticide runoff and drift, and excess nutrient runoff. Also note: do not collect the crop field aggregate from the plow pan layer of the soil. Focus on the upper 3.94 in. (10 cm) of soil for collection of samples.
- Allow the soil aggregates to air-dry for 24 to 72 hours until noticeably dry to the touch.
- Fill two large beakers or glass jars (at least one liter in size) with water and suspend a simple hardware cloth cage in the opening of each beaker. The cage should be suspended underwater and hold the soil aggregate in the upper portion of the beaker.
- Place each soil aggregate in the hardware cloth cage, ensuring it is fully covered with water. Note that bubbles may appear as water displaces air within the pore spaces of the aggregates.
- Visually compare each beaker at five minutes, 10 minutes, one hour and 24 hours. Compare the water clarity between each beaker, the aggregate size, and the amount of sediment that forms at the bottom of each beaker.
Because the slake test is a qualitative visual evaluation, it is not necessary to record data or perform additional measurements. In most cases, immediate and obvious differences between aggregate stability will occur, with intensively farmed soils producing cloudy water and eroded soil aggregates in a very short period of time.
Lab Tests
A handful of lab tests have been developed to quantify some of the components that contribute to soil health. This is an area of soil health that is dynamic and not yet solidified. Like any assessment, these are snapshots and can be best applied to establish a baseline of data and then collect the same information at later times, following management regimes. Lab test results can compare the effects of practices intended to foster soil health. Here are some of the tests:
- Soil organic matter (SOM). This cannot be directly measured, but is estimated by combining measures of soil organic carbon, total soil carbon, and the weight lost through ignition.
- Protein, potentially mineralizable nitrogen (PMN), and phospholipid fatty acids (PLFA). These tests measure organic compounds that are characteristic of bacteria and fungi and provide an estimate of microbial presence, abundance and activity.
- Aggregate stability. There are wet and dry versions of this test, which measures how well soil aggregates hold together under simulated erosive forces of water or wind.
- Bulk density. Bulk density is measured as the dry mass of soil divided by the volume and reflects the porosity, which is influenced by soil life and management practices.
- Respiration. This is a measure of the metabolic activity of the soil microbial community, also referred to as carbon mineralization. (Labs vary between 24 and 96 hours of incubation time.)
- Basic USDA Natural Resources Conservation Service (NRCS) soil health test. This consists of five core measurements: soil organic carbon, active carbon, respiration, aggregate stability and extractable protein. This is used in conjunction with a complete nutrient analysis that includes micronutrients.
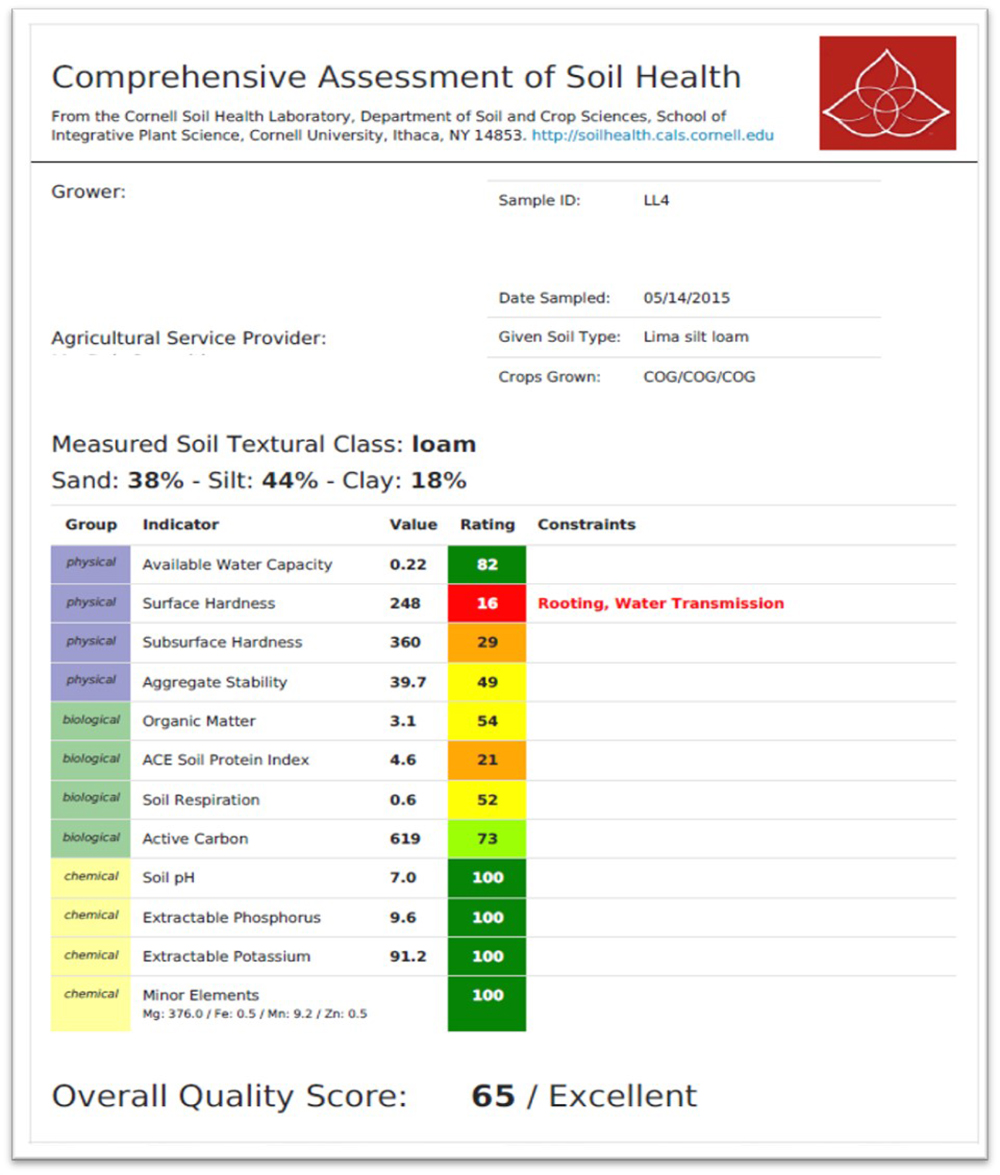
- Comprehensive assessment of soil health (CASH). Developed at Cornell University, CASH measures multiple biological, physical and chemical indicators. This includes the active carbon (Active C) protocol. Active carbon cycles faster than more recalcitrant forms and might indicate microbial activity. CASH results are presented in table format with ratings.
- Other package soil health tests are Earth Fort and VitTellus.
How to collect soil samples for lab tests:
- Accurately record location coordinates with GPS and field mark the sampling sites so that you can return to the same point and collect composite samples around the marked point.
- Gather the soil. Most tests require two to six cups of soil using multiple field subsamples. A tile spade is an ideal tool; round tools (e.g., bulb planter or golf hole cutter) and the associated twisting can interfere with aggregate stability tests.
- Be mindful to avoid cross-contamination as much as possible by cleaning shovels, tools and hands between samples.
- Keep the sample cold with ice and a cooler in the field, and pack the sample to ensure it stays cold during shipping. The lab may provide shipping materials for this.
Comparisons
The most dramatic comparisons of soil health typically occur in two scenarios: (1) crop fields versus unfarmed, vegetated land and (2) crop fields managed using long-term, continuous conventional tillage versus crop fields managed under no-till systems. Another comparison includes soil samples taken from (1) long-term monocropped fields versus fields managed under highly diverse crop rotations, and (2) overgrazed pastures versus pastures managed with rotational grazing and fallow rest periods.
Like the slake test, Berlese funnel surveys are most useful to compare the same soil type under different management systems. For example, samples of the same soil type from permanent grassland and nearby crop fields can be compared using the Berlese technique to contrast basic richness and abundance of soil organisms. Note that multiple ongoing replications of the slake test and the Berlese funnel technique can be used as a sampling protocol for more robust research projects; however, in the case of this guide, these tests are presented as simplified demonstration projects.
So far, it is not possible to make specific management recommendations (such as which cover crop species to use) based on soil health test results, but certain results would indicate following general beneficial management practices (such as using cover crops), discussed in Chapter 5. It isn’t yet possible to say, for instance, “If a pitfall trap catches X number of tiger beetles in a 24-hour period, the soil is healthy”—no biological thresholds have been determined. Instead, soil invertebrates can be grouped in functional categories, such as generalist predators or decomposers, and the diversity and abundance of each group compared before, during, and after changes to management practices. For example, in a 2008–2013 study of cover cropping systems by Purdue University researchers, soil health tests showed significant differences between conventional and no-till farming methods, but the tests did not detect differences among the various conservation treatments (such as cover crop species or type of no-till method) within no-till farming.
Keep in mind these important points when testing and comparing results:
- Pick a lab and continue to use that lab. Differences in equipment and techniques can affect the results, making accurate comparisons between tests impossible. This is very important.
- Use laboratories that have enrolled in the North American Proficiency Testing program. This program provides quality assurance and control for many laboratory tests, including the NRCS basic soil health test.
- Different testing labs use different units (either ng/g or nmol/g) for phospholipid-derived fatty acid (PLFA) measurements. To be able to compare results, use labs or tests with the same units.Measurable changes in soil health are not immediate. Allow for three years (or even five years) between tests in order to compare the effect of implementing practices that support soil health.
- There is not yet enough understanding of soil health and soil health tests to be able to set a threshold or range for what might constitute a “good” result. The best way to know if a result is good is to compare results between similar soils, cropping systems, and climate.
- CASH ratings are weighted, so each test isn’t an equal component to overall rating.
- Results are only a snapshot in time.
This material is based upon work that is supported by the National Institute of Food and Agriculture, U.S. Department of Agriculture through the Sustainable Agriculture Research and Education (SARE) program. Any opinions, findings, conclusions, or recommendations expressed in this publication are those of the author(s) and should not be construed to represent any official USDA or U.S. Government determination or policy.