The following is adapted and reprinted from A Field Guide for On-Farm Research Experiments (March 2004). Keith R. Baldwin, Ph.D. Horticulture Specialist. Cooperative Extension Program at North Carolina A&T State University, Greensboro, North Carolina. Used by permission.
To evaluate the statistics for a paired comparison, you will need a calculator that can give you the square root of a number. Or, most spreadsheet programs can perform these statistical calculations for you after you enter your data into the spreadsheet. Our objective here is to calculate the least significant difference between the two treatments.
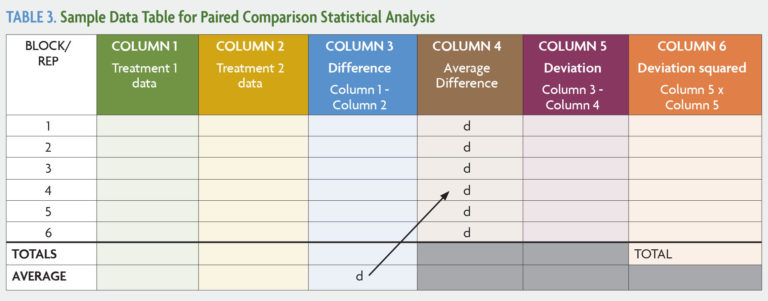
Recall that four to six replications of the treatment comparisons are usually recommended in on-farm experiments to account for field variation and the effect of chance. The following steps describe how to calculate the least significant difference for a blocked paired comparison experiment with six replications. Refer to Table 3 as you read through the instructions.
Begin by filling in the data for each block.
- Put the data (for example, yield) for Treatment 1 in Column 1.
- Put the data for Treatment 2 in Column 2.
- In Column 3, subtract the number in Column 2 from the number in Column 1. (Some numbers in Column 3 may be negative, which is completely normal.)
- Calculate the average of each of the first three columns. You do this by adding up all the numbers in the column (positive and negative) and dividing by the total number of blocks (six in this case).
- Copy the Column 3 average (labeled “d” in Table 3) into every row in Column 4. (This will be the same number in every row.)
- In Column 5, subtract the number in Column 4 from the number in Column 3. Negative numbers can be tricky. Remember that (-5) - 5 = - 10. But also remember that subtracting a negative number is the same as adding it as a positive number. For example, (-5) - (-5) is the same as (-5) + 5, which equals 0.
- In Column 6, square the number in Column 5 (multiply it by itself). Note that a negative number squared becomes a positive number. For example, (-10) x (-10) = 100.
- Add all the numbers in Column 6. Record this value. In statistics, this is the sum of squares.
- Subtract 1 from the number of blocks. Record this value. In this case, 6 blocks - 1 = 5. In statistics, this is the degrees of freedom.
- Divide the sum of squares (from step 8) by the degrees of freedom (from step 9). Record this value. This is the variance.
- Divide the variance (from step 10) by the number of blocks. Record this value. This is the variance of the means.
- Take the square root of the variance of the means (from step 11). Record this value. This is the standard error.
- Select the t-distribution critical value based on the number of blocks (replications) in the experiment and level of confidence you want in the statistics. The t-value is a predetermined value that can be found in Table 4. Multiply the standard error (from step 12) by the selected t-value. The product is the least significant difference, or LSD.
TABLE 4. T-Distribution Critical Values
| NUMBER OF BLOCKS | DEGREES OF FREEDOM | T-VALUE FOR 90 PERCENT CONFIDENCE LEVEL | T-VALUE FOR 95 PERCENT CONFIDENCE LEVEL |
| 4 | 3 | 2.35 | 3.18 |
| 5 | 4 | 2.13 | 2.78 |
| 6 | 5 | 2.02 | 2.57 |
Recall that the LSD tells us how large the difference between treatments needs to be to: 1) account for possible errors and random events, and 2) to provide a degree of certainty (90 percent or 95 percent, depending on which you choose) that the difference is real, or “significant.” If the average difference between treatments (the bottom figure in Column 3 in Table 3) is smaller than the LSD, it is too small a difference to draw any conclusions from the experiment. If the average difference is greater than the LSD, then the treatments are significantly different at the selected confidence level, and conclusions about the treatments may be drawn.
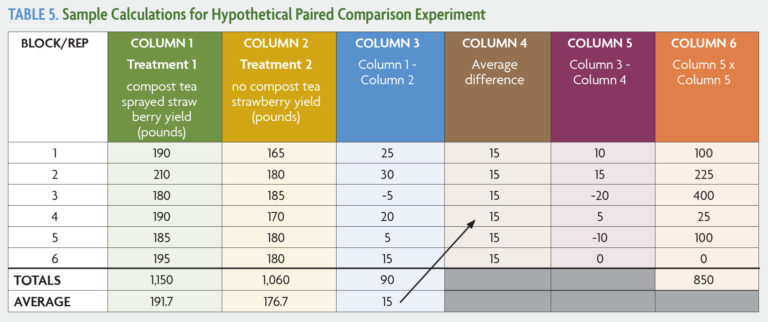
A sample statistical calculation is shown in Table 5. In this hypothetical experiment, a grower wants to determine the effect of compost tea spray on strawberry yield. In a randomized and replicated experimental field (with buffer beds between treatment beds), she collects yield data from six beds that were sprayed with compost tea (Treatment 1) and six beds that were not sprayed with anything (Treatment 2).
Continuing with step 8 from the instructions:
- Add the numbers in Column 6. Sum of squares = 850.
- Subtract 1 from the number of blocks to get the degrees of freedom. 6 - 1 = 5.
- Divide 850 by the degrees of freedom to get the variance. 850/5 = 170.
- Divide 170 by the number blocks to get the variance of the means. 170/6 = 28.3. Calculate the square root of the variance of the means to get the standard error. √28.3 = 5.32.
- Multiply this answer by the selected t-value (step 13). In this case, the farmer wants to be 95 percent confident that her results are significant, so she chooses 2.57. 5.32 x 2.57 = 13.67.
Finally, compare the average difference from Column 4 with the LSD. In this example, the farmer finds that the average difference of 15 is greater than the LSD of 13.67. The farmer concludes with confidence that the compost tea treatment increased yield. Using proper research design and statistics lets the farmer draw this conclusion even though in one paired comparison the yield in the untreated crop was greater.
Software programs are available that will do statistical calculations for you. Most spreadsheet programs can perform a simple statistical analysis after you type in your data. For more information, contact your technical advisor.


