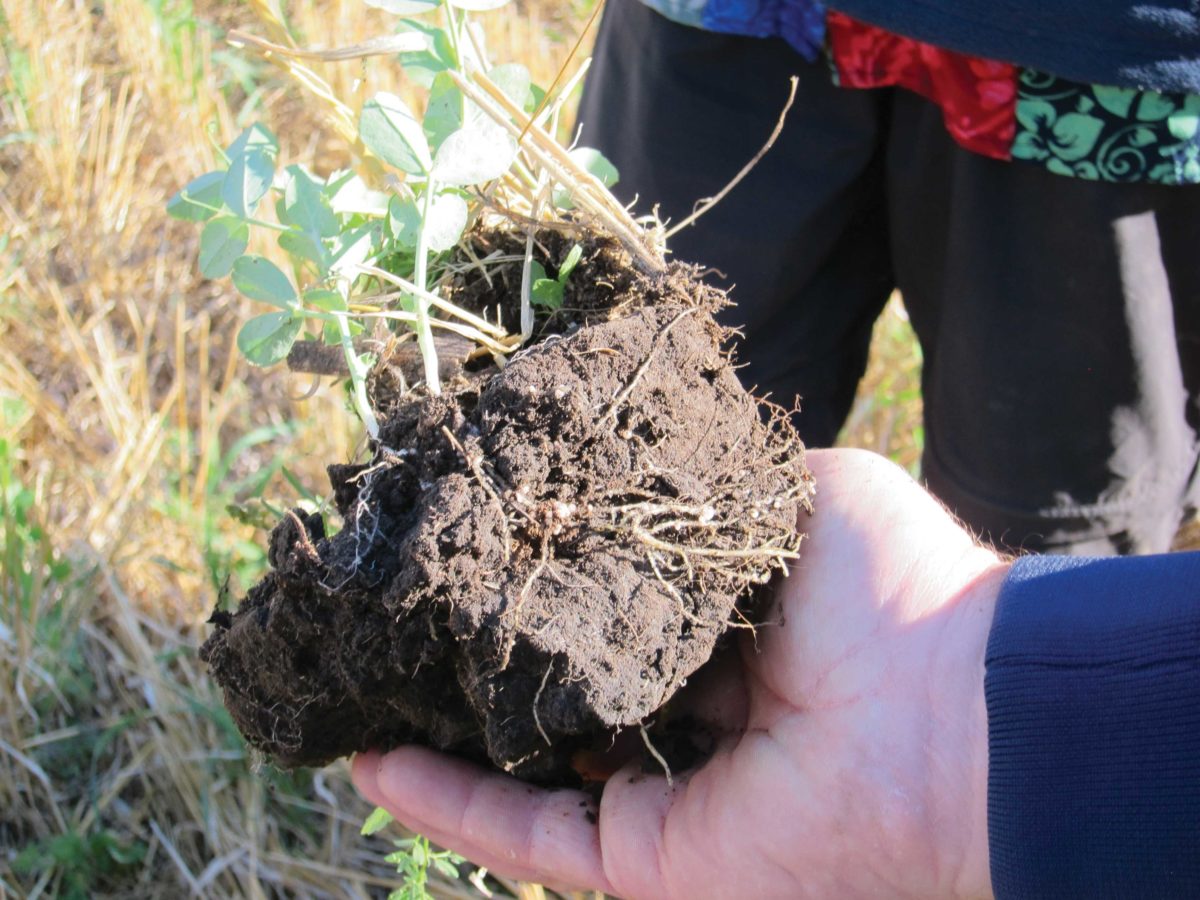
Cover crops are often an essential part of an organic farmer’s strategy to supply nutrients to their crops, particularly through nitrogen-fixing legumes. Some legumes, such as hairy vetch and Austrian winter peas, can supply over 100 pounds of nitrogen per acre if allowed to grow until they flower. However, for conventional farmers, it has normally been cheaper to obtain nitrogen from synthetic fertilizer than from cover crops. This is particularly true for corn, which is planted before legumes have much chance to grow in spring.
New developments in understanding soil health and soil-nutrient cycling are leading to a recognition that cover crops can do more than just fix nitrogen (assuming the cover is a legume). They can play an important role in sequestering nutrients from manure or nutrients that are left at the end of a cash crop season. This sequestration can prevent those nutrients from being lost from the root zone. Nitrogen sequestration is particularly important, given its mobility in the soil and the chance of both nitrogen leaching and denitrification (when soil nitrogen goes into the atmosphere as a gas).
Soil biology also plays a greater role than previously understood in soil- and crop-nutrient dynamics. Cover crops, by increasing the portion of the year with living roots in the soil, stimulate soil biology and can enhance the growth of mycorrhizal fungi, particularly if soil disturbance is minimized. These changes in soil biology can begin in the first year of cover crop use, and they continue as soil health improves. Fungi and bacteria contribute nutrients to plant roots in exchange for carbohydrate exudates from the roots. Cash crops may also root more deeply following a deep-rooted cover crop, and earthworms create nutrient-rich tunnels that roots can access. These changes can occur in the soil fairly quickly, allowing a short-term fertility response. In the long term, organic matter starts to improve, which also increases the pool of nutrients annually available in the soil. For these reasons, modest fertilizer cost savings are often possible with cover crop use, including where legumes are used to fix nitrogen. Moreover, the amount of those cost savings increases over time as soil health improves.
Researchers and farmers are still working to understand the optimum amount of fertilizer efficiency that can be achieved with cover crops. From what is currently known, the most straightforward steps are to soil test regularly for phosphorus and potassium levels and to consider using sensor technology or tissue testing to evaluate in-season nitrogen needs in corn. The in-season nitrogen evaluation can be used to guide side-dress fertilizer applications rather than applying all the nitrogen fertilizer before planting the cash crop. Using the latest soil health tests can also provide insights on how to best manage a field’s fertility.
For now, we know that fertilizer needs will gradually decline over time as cover crops improve soils and after a few years may lead to a savings of $10–$40 per acre in fertilizer costs for corn and $5–$10 for soybeans. Soybean savings are lower due to the fact they produce their own nitrogen. The biggest potential in saving fertilizer costs is from using legume cover crops that can fix sufficient nitrogen to contribute to commodities such as corn, sorghum or cotton, but the overall improvements in soil health and increased mycorrhiza can certainly provide fertility dividends as well.
Snapshot: The financial impact of extra fertilizer savings
Cover crops break even in year two for corn and pay off by year three for soybeans, assuming a field situation where soil fertility can be improved by cover crops. Returns for corn average -$16.16, $16.62 and $33.10 per acre after one, three and five years of planting a cover crop. Soybean returns average -$16.55, $7.42 and $17.18 per acre after one, three and five years. (See Table 4 and Table 5 for details.) See the footnotes in tables 4 and 5 for details on specific fertilizer assumptions.
