Completely Randomized Design
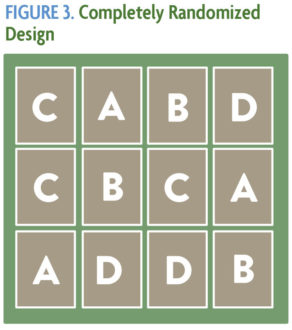
The simplest experimental layout is a completely randomized design (Figure 3). This layout works best in tightly controlled situations and very uniform conditions. For this reason, the completely randomized design is not commonly used in field experiments. You can use it if you are working with a very uniform field, in a greenhouse or growth chamber, or if you have no idea about the variability in your field. The statistical analysis of completely randomized designs is not covered in this publication.
Paired Comparison
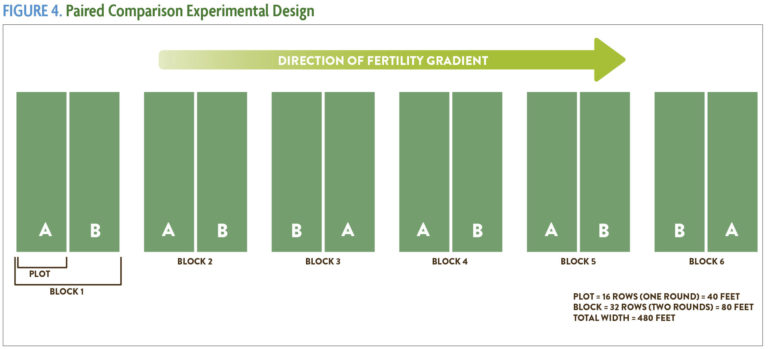
As the name implies, the paired comparison is used to compare the effect of two different treatments assigned randomly within blocks. Each block contains two plots—one plot of each treatment—and blocks are replicated four to six times across the field. Typically, plots run the length of the field and are one or two tractor widths in order to facilitate management. Figure 4 shows the layout for a typical paired comparison experiment.
In collecting yield data or other samples from the field, measurements are generally taken from the center rows of a plot in order to avoid any “edge effects.” You can use this design to evaluate any pair of treatments: comparing two varieties, growing the crop with and without starter fertilizer, comparing two rates of fertilizer application, comparing the timing of nutrient application, or using two different cover crop treatments, for example. The paired comparison is a type of randomized block design, but it is usually classified on its own since we use a simplified statistical analysis, the t-test, to analyze the data when compared to the standard randomized complete block design (described next). The t-test will help you determine whether the difference you observe in two treatments is due to natural variation or is a real difference. It is described in the section, Using the t-Test to Compare Two Treatments.
Randomized Complete Block
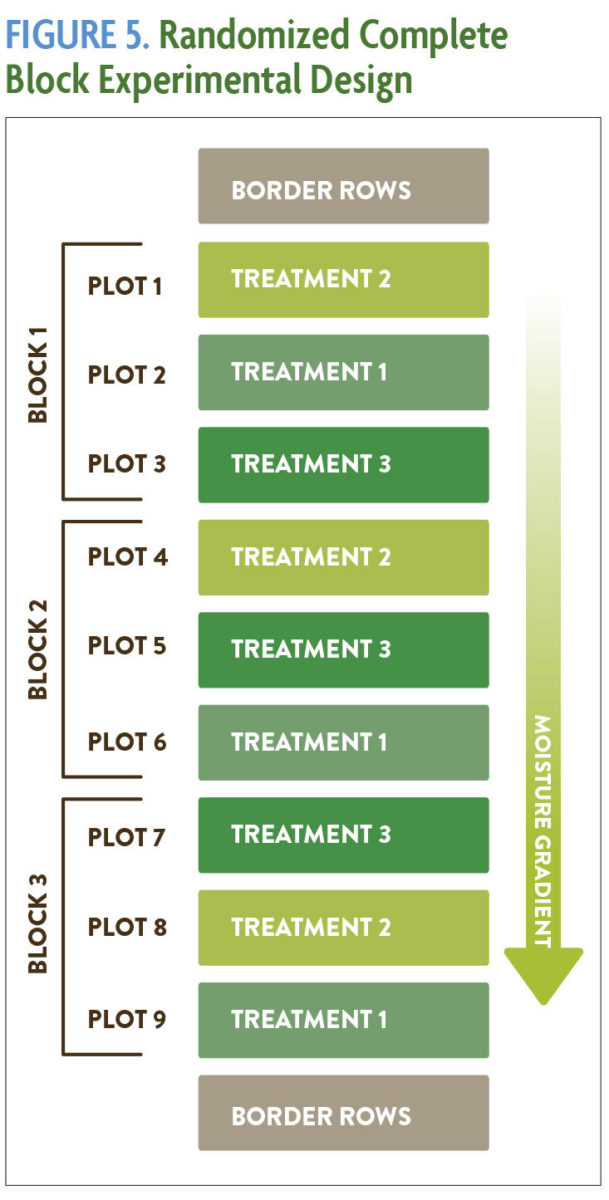
The randomized complete block design is used to evaluate three or more treatments. As with the paired comparison, blocking and the orientation of plots helps to address the problem of field variability as described earlier (Figure 3). Each block contains a complete set of treatments, and the treatments are randomized within each block. Four to six replications of a “complete block” are sufficient for most on-farm research projects. Figure 5 shows a schematic of a randomized complete block design with three treatments. The statistical test known as analysis of variance (ANOVA) is used to analyze the data from a randomized complete block experiment.
Split-Plot
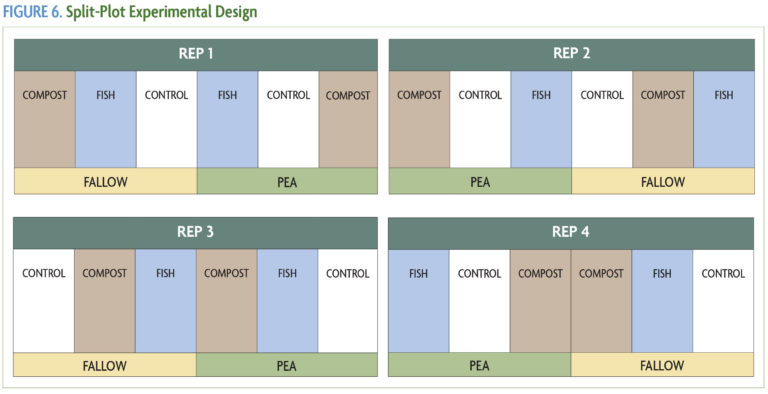
The split-plot design is for experiments that look at how different sets of treatments interact with each other. It is also used when one of the treatment factors needs more replication or when it is difficult to change the level of one of the factors. For example, in a cover crop study, it may be most convenient due to machinery limitations to plant cover crops in larger areas (the main plots) and then impose other treatments such as fertilizer rates in the sub-plots. In this design, main treatments are overlaid with another set of sub-treatments. Though fairly easy to set up in the field, a split-plot experiment will usually take up a larger area and be more complex to implement, manage and analyze. Given the greater number of treatments and the interaction component, using ANOVA for the split-plot design is also more complex than with the paired comparison or the randomized complete block. It is best to work with someone who has expertise in this type of research design when setting up a split-plot experiment. An example of a split-plot design is shown in Figure 6.


